


U.S. Indices Technical Highlights:
- S&P 500 powerful reversal sets up recovery, for now
- Dow Jones pierces support but closed back above
- Nasdaq 100 bounce would be outside bullish channel

Dow Jones, S&P 500, Nasdaq 100 Forecast: Bounce Then Sell Set-up
The S&P 500 had a wicked drop and reverse yesterday, one that may put in a short-term low but fail to hold as a meaningful low looking out over longer time-frames. The decline off the early month record highs may indeed be the “shot across the bow” before a larger decline unfolds.
Keep in mind that the market has become conditioned to believe each dip holds an opportunity to get long and benefit from new highs, and maybe that holds true again this go-around, but one of these times that notion will be tested and fail. If we see the market recover over the next few days to few weeks, but then start to fizzle, behavior will have changed and we could be setting up for another nasty leg lower.
Levels to watch on the top-side as resistance arrive at 4495, 4531, followed by 4582, the last likely level to get tagged on a bounce if a continuation lower is to unfold.
The recovery sequence could also carve out the right shoulder of a head-and-shoulders pattern, with the left shoulder occurring in September and head in January. In this scenario the right shoulder would likely develop next month, early March at the latest.
S&P 500 Daily Chart

The Dow Jones is interesting because it has a fair amount of support at its feet right now. It pierced through several support levels dating to June, but managed to close above them all. A bounce will first have the 200-day moving average in focus, currently at 34965. Other than that the levels aren’t as clear as they are in the SPX. On that, following the lead of the broader market.
Dow Jones Daily Chart

Dow Jones Chart by TradingView
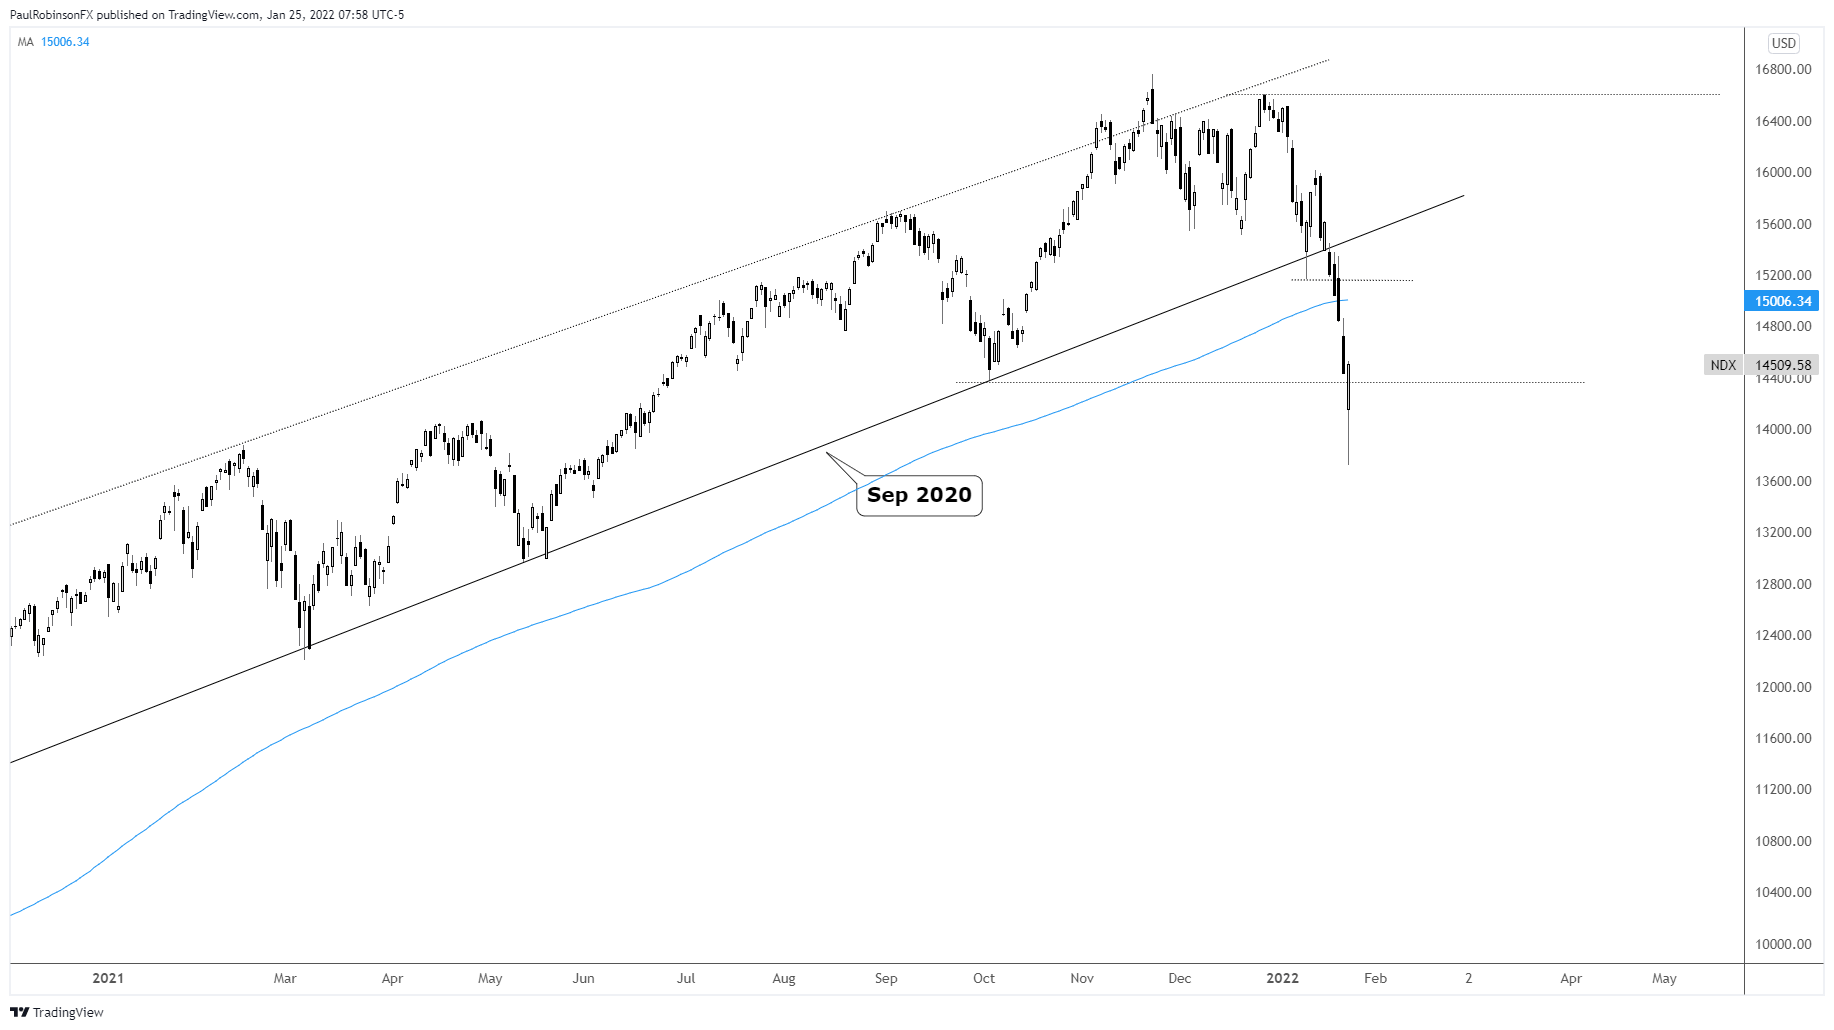
The Nasdaq 100 is trading outside the bullish channel extending from September 2020 until it broke last week. The breaking of the channel has severely undermined the broader outlook for this market-leading index. First up as resistance is the 200-day MA at 15006, with potential to tag the underside trend-line of the bull channel.
Like the SPX, the NDX can also carve out a solid-looking head-and-shoulders pattern with a little bit of time and upward price action. Whether a clean pattern emerges or not, the outlook for the NDX, and by extension the broader market, appears at major risk of further downside in the relatively near future.
Nasdaq 100 Daily Chart
Nasdaq 100 Chart by TradingView
Resources for Forex Traders
Whether you are a new or experienced trader, we have several resources available to help you; indicator for tracking trader sentiment, quarterly trading forecasts, analytical and educational webinars held daily, trading guides to help you improve trading performance, and one specifically for those who are new to forex.
---Written by Paul Robinson, Market Analyst
You can follow Paul on Twitter at @PaulRobinsonFX


