


S&P 500 Technical Price Outlook: Short-term Trade Levels
- S&P 500 technical trade level update – Daily & Intraday Charts
- SPX500 carves opening-range above support pivot – breakout to offer guidance
- SPX Resistance 4221/28, ~4325, 4368/91 (critical) - Support 4089-4105, 4001, 3916(key)
The S&P 500 has surged more than 15% off the yearly lows with the rally losing steam into the August open. A well-defined opening-range is taking shape ahead of key US inflation data tomorrow and we’re looking for a near-term breakout to offer guidance in the days ahead. These are the targets and invalidation levels that matter on the SPX500 technical price charts into the close of the week. Review my latest Strategy Webinar for an in-depth breakdown of this SPX500 setup and more.
S&P 500 Price Chart – SPX500 Daily
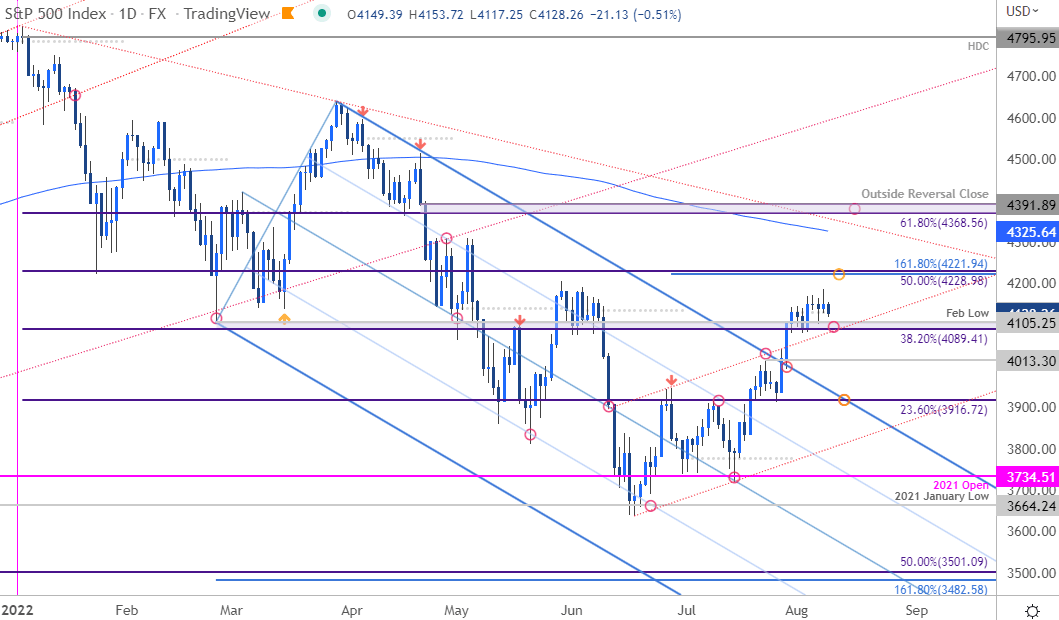
Chart Prepared by Michael Boutros, Technical Strategist; SPX500 on Tradingview
Technical Outlook: In last month’s S&P 500 Short-term Technical Outlook we noted that the, “immediate focus is on a clear break of the objective monthly (July) opening-range for guidance.” The index breached the topside of the monthly range on the 19th with the SPX500 surging more than 6.1% into the August open. The breakout cleared yearly downtrend resistance and while further upside potential remains, the immediate advance may be vulnerable to near-term exhaustion here.
S&P 500 Price Chart – SPX500 240min
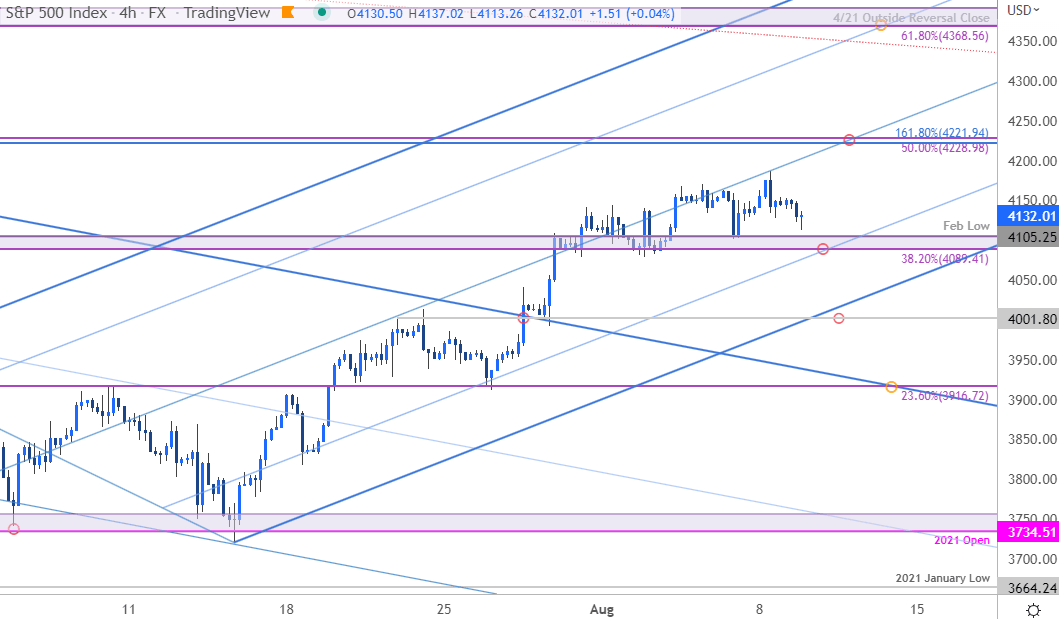
Chart Prepared by Michael Boutros, Technical Strategist; SPX500 on Tradingview
Notes: A closer look at SPX500 price action shows the index trading within the confines of an ascending pitchfork formation extending off the June / July lows with the median-line holding resistance into the start of the month. The weekly & monthly opening-range range is being carved out just above support here at the 38.2% retracement of the yearly range / February low at 4089-4105. Subsequent support rests with the lower parallel / 4001 with near-term bullish invalidation now raised to 3916- a break / close below this threshold would be needed to mark resumption of the downtrend.
Initial resistance stands at the confluence of the 50% retracement and the 1.618% extension of the June rally at 4221/28- look for possible price inflection there IF reached with a topside breach needed to keep the long-bias viable towards critical resistance at the 61.8% retracement / March 21st outside reversal close at 4368/91.

Bottom line: The S&P 500 rally may be vulnerable near-term with the weekly / monthly opening range breakout to offer further guidance in the days ahead. From a trading standpoint, a good region to reduce portions of long-exposure / raise protective stop – losses should be limited to 3916 IF price is heading higher on this stretch with a close above the median-line needed to fuel the next leg towards 4368. Stay nimble heading into key US inflation data tomorrow with the event likely to fuel added volatility in risk sensitive markets. Review my last S&P 500 Weekly Technical Forecast for a closer look at the longer-term SPX 500 technical trade levels.
For a complete breakdown of Michael’s trading strategy, review his Foundations of Technical Analysis series on Building a Trading Strategy
S&P 500 Trader Sentiment – US500 Price Chart

- A summary of IG Client Sentiment shows traders are net-short the S&P 500- the ratio stands at -1.79 (35.79% of traders are long) – typically a bullishreading
- Long positions are2.78% lower than yesterday and 5.50% lower from last week
- Short positions are 1.71% higher than yesterday and 9.46% higher from last week
- We typically take a contrarian view to crowd sentiment, and the fact traders are net-short suggests SPX500 prices may continue to rise. Traders are further net-short than yesterday and last week, and the combination of current positioning and recent changes gives us a stronger S&P 500 contrarian trading bias from a sentiment standpoint.

Economic Calendar

Economic Calendar - latest economic developments and upcoming event risk.
Active Technical Setups
- Gold Price Short-term Technical Outlook: Gold Rally at Trend Resistance
- Canadian Dollar Short-term Price Outlook: USD/CAD Rebound Faces NFP
- Crude Oil Short-term Outlook: WTI Spills Lower- Support in View
- Nasdaq Technical Outlook: NDX Fed Rally Faces Downtrend Resistance
- EUR/USD Short-term Technical Outlook: Euro Recovery Stalls into Fed
- Dow Jones Technical Forecast: DJI Rebound Faces Downtrend Resistance
-Written by Michael Boutros, Technical Strategist with DailyFX
Follow Michael on Twitter @MBForex


