
US Dollar Outlook:
- The US Dollarhas reversed dramatically after the January US inflation rate report (CPI), with the DXY Index working on a bearish outside engulfing bar.
- But with Fed rate hike odds climbing alongside US Treasury yields, USD/JPY rates are still in the early stages of a bullish triangle breakout.
- The IG Client Sentiment Index suggests that USD/JPY has a bullish bias in the near-term.

Jump Then Slump
It’s been a brutal few hours for the US Dollar. While the January US inflation rate report (CPI) initially helped spark the DXY Index to its highest level in a week, sellers soon came in thereafter and have provoked a dramatic turn in the technical picture. Instead of being on the verge of its first close above its daily 21-EMA (one-month moving average) for the first time since February 1, the DXY Index is now working on a daily bearish outside engulfing bar, suggesting formidable resistance has formed near 96.00.
Alas, while this is bad news for most USD-pairs, there is one standout for greenback bulls: USD/JPY rates. The combination of higher US Treasury yields, higher Fed rate hike odds, and rallying oil prices is a bad mix for the Japanese Yen, which has afforded USD/JPY rates to continue with their bullish symmetrical triangle breakout identified last week ahead of the January US nonfarm payrolls report.
DXY PRICE INDEX TECHNICAL ANALYSIS: DAILY Timeframe (February 2021 to February 2022) (CHART 1)
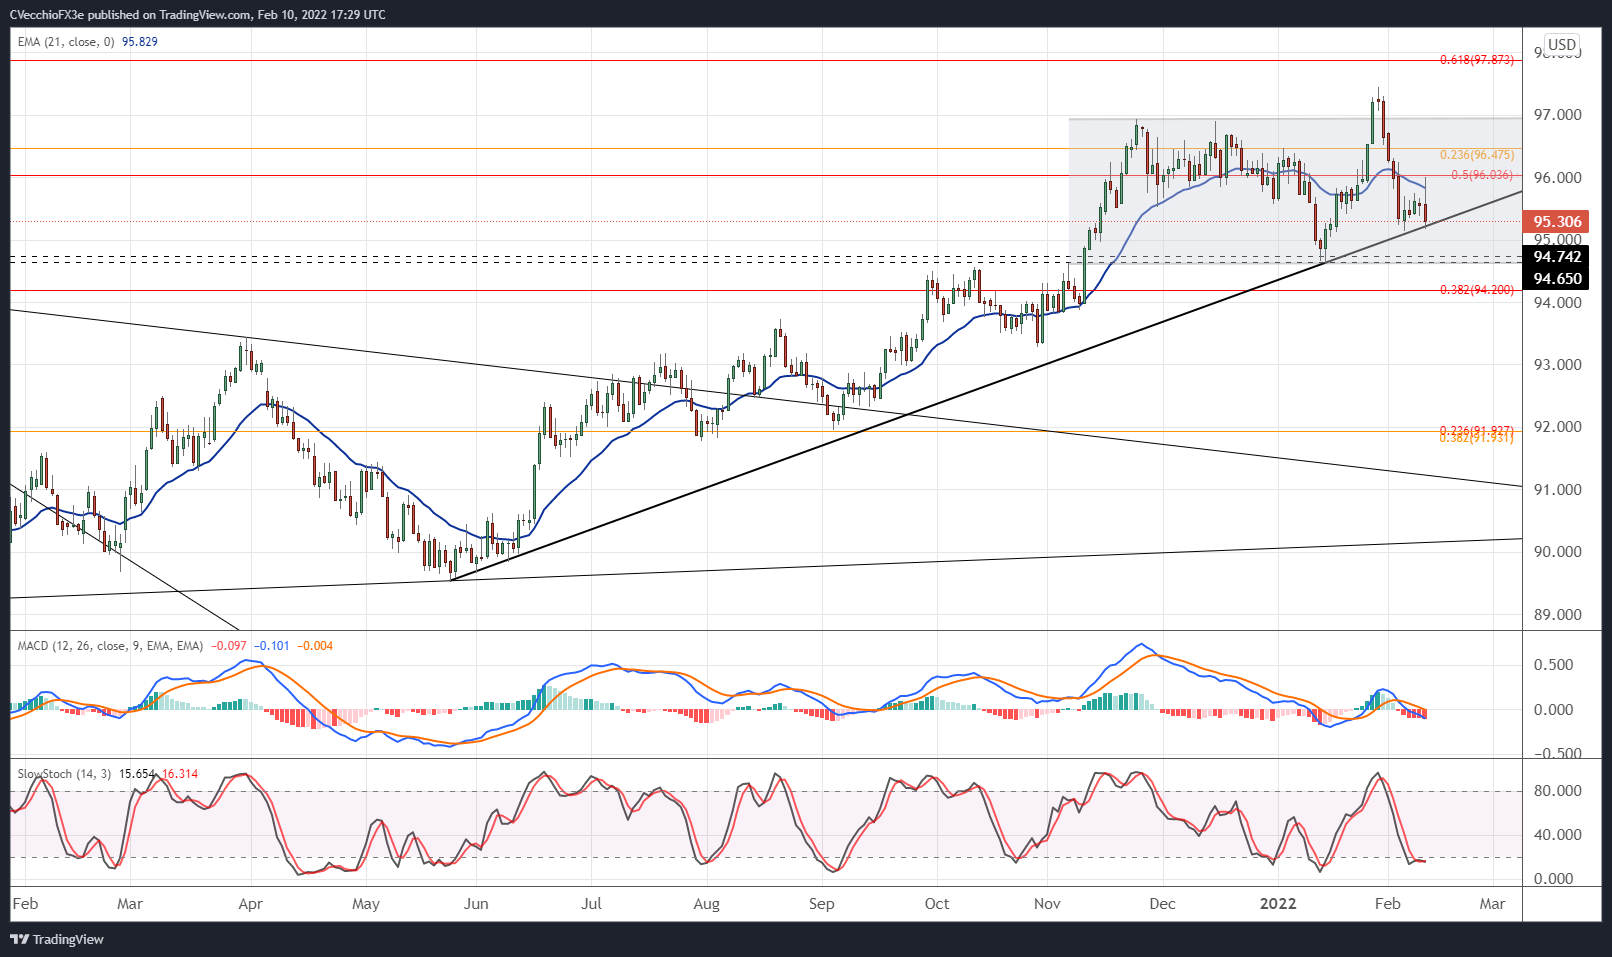
The DXY Index rally ran into resistance at its daily 21-EMA as well as the 50% retracement of the 2017 high/2018 low range today. With a daily bearish outside engulfing bar forming, the charts are telling us that 96.00 must be overtaken before any broad-based bullish point of view is to be taken seriously in the near-term. For now, rising trendline support from the May 2021 and January 2022 swing lows is holding up for the second time this month.
While rising US Treasury yields and higher Fed rate hike odds suggests that a greenback sell-off should be limited, a drop below 95.25 warns of a quick flush to the 2022 lows are down near 94.63 – right near where the March 2020 low, September 2020 high, and September to early-November 2021 highs were carved out.

USD/JPY RATE TECHNICAL ANALYSIS: DAILY TIMEFRAME (January 2021 to February 2022) (CHART 2)

In spite of the DXY Index’ recent struggles, USD/JPY rates remain resilient. Consistent with last week’s observation that “a symmetrical triangle may be forming since late-November, which in context of the preceding move, would look for resolution higher,” USD/JPY rates appear to be in the early stages of their next leg to the topside.
Bullish momentum has been steadily improving in recent sessions, despite today’s pullback from a fresh 2022 high. USD/JPY rates are above their daily 5-, 8-, 13-, and 21-EMA envelope, which remains in bullish sequential order. Daily MACD is trending higher while above its signal line, and daily Slow Stochastics are now in overbought territory. ‘Buy the dip’ opportunities are eyed so long as USD/JPY rates hold above symmetrical triangle resistance (now support), coming in near 115.20 over the next few sessions.
IG Client Sentiment Index: USD/JPY RATE Forecast (February 10, 2022) (Chart 3)
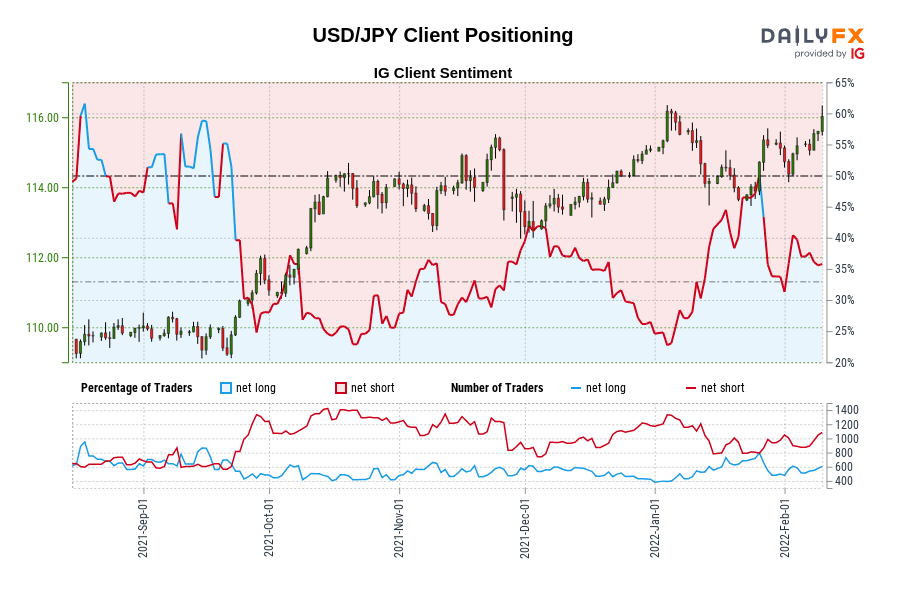
USD/JPY: Retail trader data shows 28.20% of traders are net-long with the ratio of traders short to long at 2.55 to 1. The number of traders net-long is 27.64% lower than yesterday and 18.80% lower from last week, while the number of traders net-short is 4.81% higher than yesterday and 30.08% higher from last week.
We typically take a contrarian view to crowd sentiment, and the fact traders are net-short suggests USD/JPY prices may continue to rise.
Traders are further net-short than yesterday and last week, and the combination of current sentiment and recent changes gives us a stronger USD/JPY-bullish contrarian trading bias.

--- Written by Christopher Vecchio, CFA, Senior Strategist