
Canadian Dollar Talking Points:
- Oil prices have put in a stern bounce from a big area of support, helping to revive CAD-strength themes.
- USD/CAD has plummeted down to a key support zone and CAD/JPY has put in an admirable recovery after a late-November sell-off. But prior support is now showing as resistance in the pair.
- The analysis contained in article relies on price action and chart formations. To learn more about price action or chart patterns, check out our DailyFX Education section.
Canadian Dollar strength has come rushing back the day before the Bank of Canada’s December rate decision. The currency was beset by some aggressive weakness after topping out in October. And as a combination of US Dollar strength and Oil weakness took over, prices continued to spike-higher in USD/CAD.
I had warned of resistance in the pair last week at the 1.2850 level. That resistance has held and so far this week, the pair is already down by more than 200 pips while retracing 38.2% of that prior bullish move in USD/CAD. I had written about the matter yesterday as part of t he US Dollar Price Action Setups for this week, honing in on the 1.2750 psychological level before a larger spot of support came into play. The 2750 level was shredded through already so the look at this point is for support to develop in a familiar area on the chart, taken from the 1.2622 Fibonacci level up to another Fibonacci level of note around 1.2672.
This zone is relevant as it’s been in-play for practically the entire year. It started to set support in the opening days of 2021 trade. And now there’s another level of confluence in that range, with the 38.2% retracement of the recent bullish move plotting at 1.2638, which is currently holding the low as of this writing.
USD/CAD Daily Price Chart

Chart prepared by James Stanley; USDCAD on Tradingview
CAD/JPY Support, Prior Resistance
I’ve been following CAD/JPY for bullish Canadian Dollar scenarios. And that was a solid setup all the way into Black Friday, at which point a wave of risk aversion took over on news of the Omicron variant, and prices plunged by more than 300 pips and through a key spot of confluent support around the 90.00 handle.
With risk tolerance coming back as oil prices have bounced from a key spot of support, the pair has started to recover. But that prior area of key support now is showing up as resistance. So, there’s a few possible ways to proceed forward.
First and foremost, the spot around the 90 handle is resistance potential. For bears, they can look for a hold in that spot at which point the door can open for a bearish swing.
Alternatively, for those that are bullish CAD and want to look for a deeper recovery, look to the confluent zone around 90.00 as a test. A breach back-above this spot can re-open the door for longs. I’ve got the topside of the zone marked around 90.24, so traders would want to see that level broken-through first, at which point they can look to catch higher-low support with the aim of bullish continuation.
As another alternative, bulls could also look for a pullback towards the 89.00 handle, a Fibonacci level that had helped a prior point of resistance form as prices started to reverse.
CAD/JPY Daily Price Chart
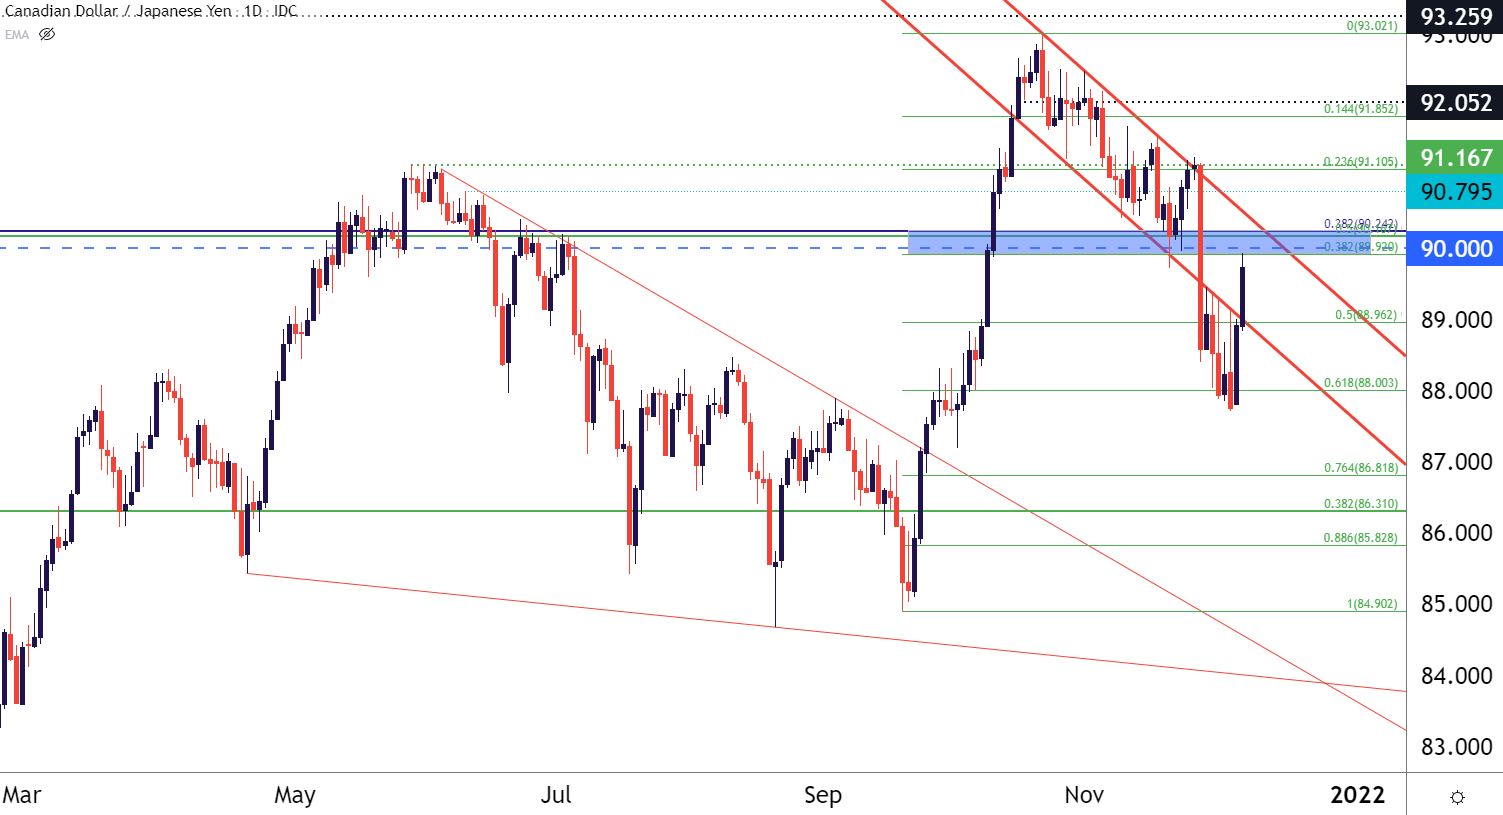
Chart prepared by James Stanley; CADJPY on Tradingview
--- Written by James Stanley, Senior Strategist for DailyFX.com
Contact and follow James on Twitter: @JStanleyFX