

- Gold prices eye upper bounds of broad consolidation pattern- focus is on resistance at 1433
- Check out our 2019 projections in our Free DailyFX Gold Trading Forecasts
- Join Michael for Live Weekly Strategy Webinars on Mondays at 12:30GMT
Gold prices are approaching the upper bounds of a multi-week consolidation formation just below six-year highs – its make or break for the bulls. These are the updated targets and invalidation levels that matter on the XAU/USD charts this week. Review this week’s Strategy Webinar for an in-depth breakdown of this Gold setup and more.
New to Gold Trading? Get started with this Free How to Trade Gold -Beginners Guide
Gold Price Chart - XAU/USD Daily
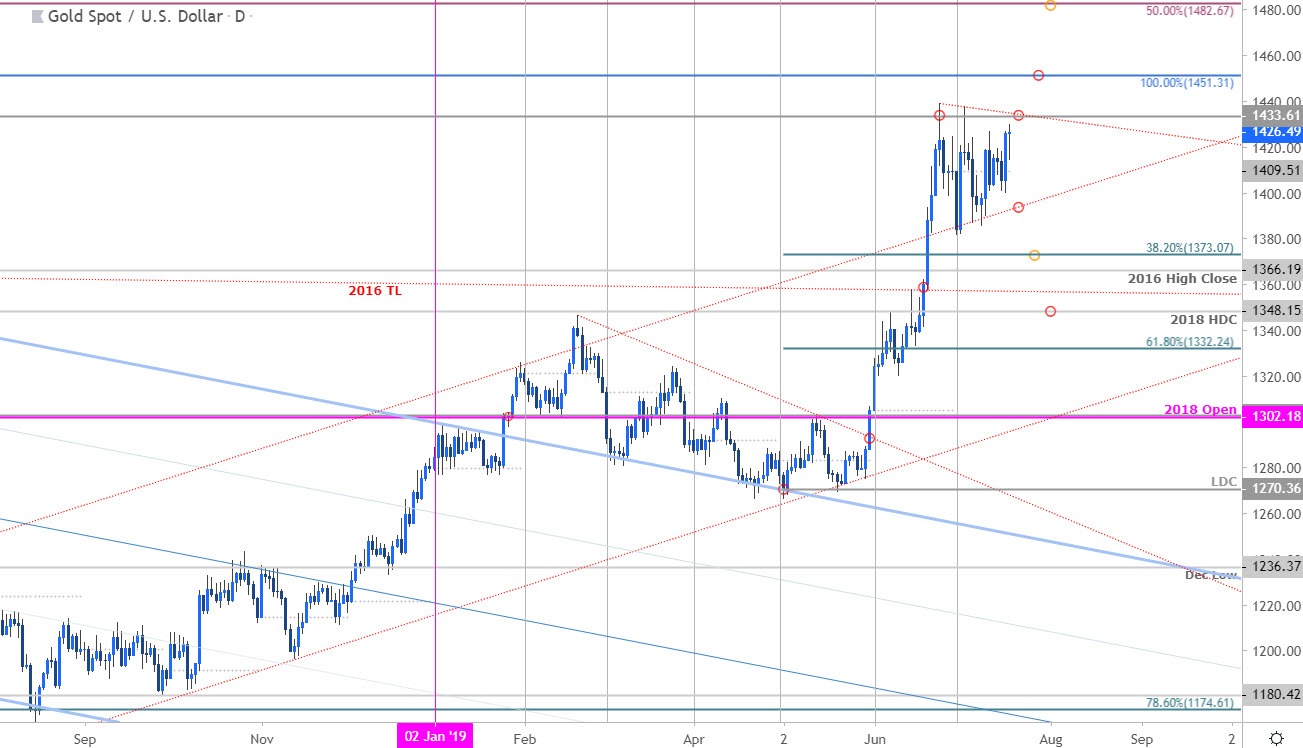
Technical Outlook: In my latest Gold Price Weekly Outlook we noted that XAU/USD was trading within, “a multi-week consolidation pattern just below resistance- look to the break for guidance.” Price is approach the upper bounds of this consolidation range with daily resistance steady at the August 2013 high at 1433. A breach / close above this threshold is needed to validate the breakout with such a scenario eyeing subsequent resistance targets at 1451 backed by the 50% retracement of the decline off the record highs at 1483.
Gold Price Chart - XAU/USD 120min
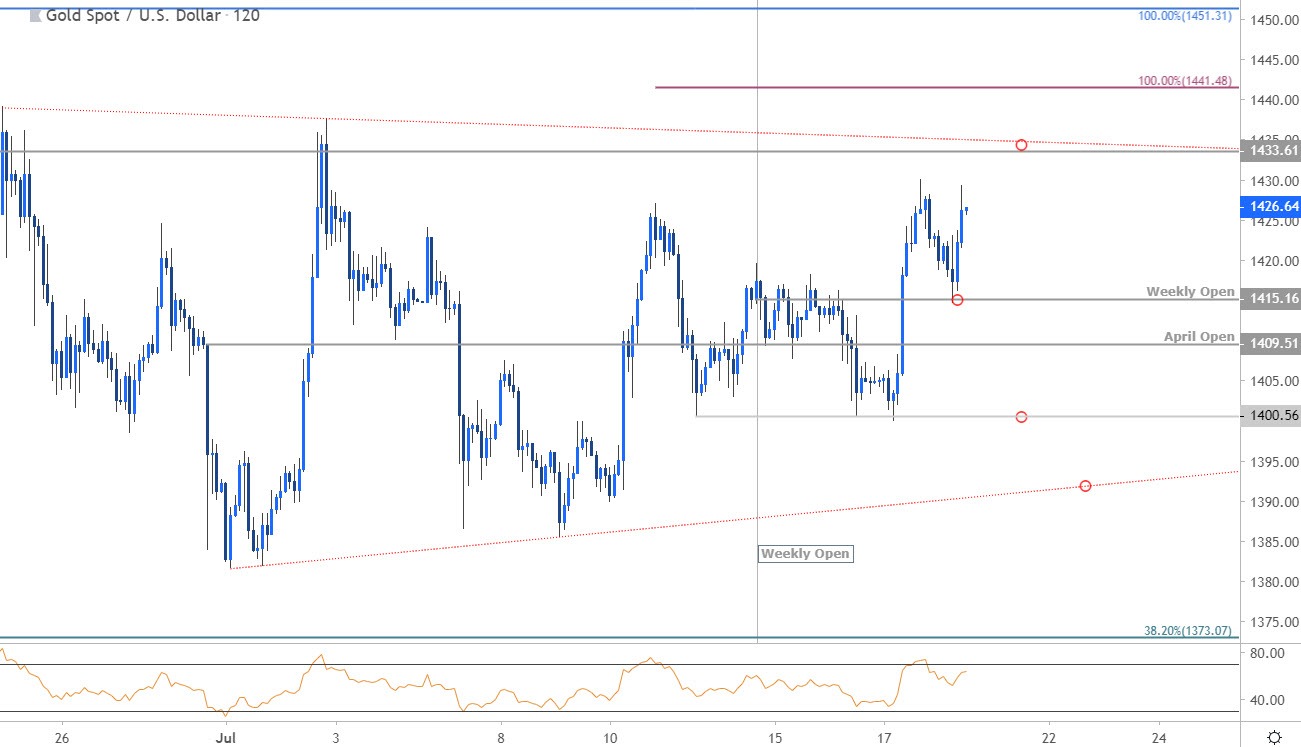
Notes: A closer look at gold price action shows gold breaking above the weekly opening-range highs on an outside-day reversal candle yesterday with price defending weekly open support today at 1415. The focus is on a breach above consolidation resistance at 1433/35 to keep the long-bias in play targeting 1441 and 1451. Monthly open support rests at 1409 backed by 1440 – ultimately a break / close below the July support line, currently ~1390 needed to suggest a larger correction is underway.
Why does the average trader lose? Avoid these Mistakes in your trading
Bottom line: The focus remains on a break of the broader multi-week consolidation range with price now approaching the upper bounds of the formation. From a trading standpoint, look to raise protective stops on a move into 1433 with a breach / close above needed to keep the topside advance viable. Be on the lookout for possible near-term exhaustion IF price fails to close above this level this week. Ultimately a larger pullback may offer more favorable long-entries while above former slope resistance / 1390. Review our latest Gold 3Q Forecast for a longer-term look at the technical picture for XAU/USD prices.
For a complete breakdown of Michael’s trading strategy, review his Foundations of Technical Analysis series on Building a Trading Strategy
Gold Trader Sentiment
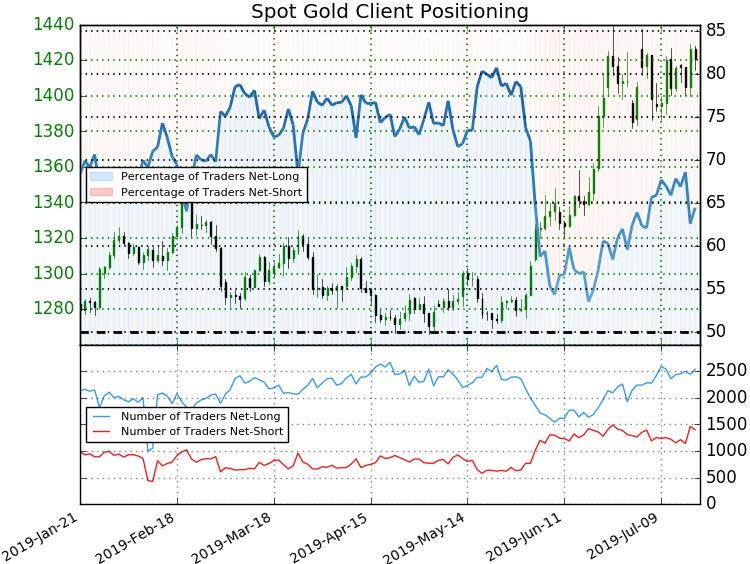
- A summary of IG Client Sentiment shows traders are net-long Gold- the ratio stands at +1.81 (64.4% of traders are long) – bearishreading
- Long positions are1.4% lower than yesterday and 2.1% higher from last week
- Short positions are8.9% higher than yesterday and 2.1% lower from last week
- We typically take a contrarian view to crowd sentiment, and the fact traders are net-long suggests Spot Gold prices may continue to fall. Yet traders are less net-long than yesterday but more net-long from last week and the combination of current positioning and recent changes gives us a further mixed Gold price trading bias from a sentiment standpoint.
See how shifts in Gold retail positioning are impacting trend- Learn more about sentiment!
---
Active Trade Setups
- Sterling Price Chart: British Pound Testing Post-Brexit Support
- Canadian Dollar Price Chart: Loonie Drives USD/CAD to Weekly Support
- Aussie Weekly Price Chart: Australian Dollar Testing Key Resistance
- Written by Michael Boutros, Currency Strategist with DailyFX
Follow Michael on Twitter @MBForex