


Gold - XAU/USD Technical Analysis

Gold Price – Buyers in Control
Today, Gold buyers resumed bullish price action and rallied the price to $1,588 – its highest level in over six years. Some buyers took profit, and this led XAU/USD to fall below $1,580.
The Relative Strength Index (RSI) pointed higher towards 89 highlighting the strength of bullish momentum.
Having trouble with your trading strategy? Here’s the #1 Mistake That Traders Make
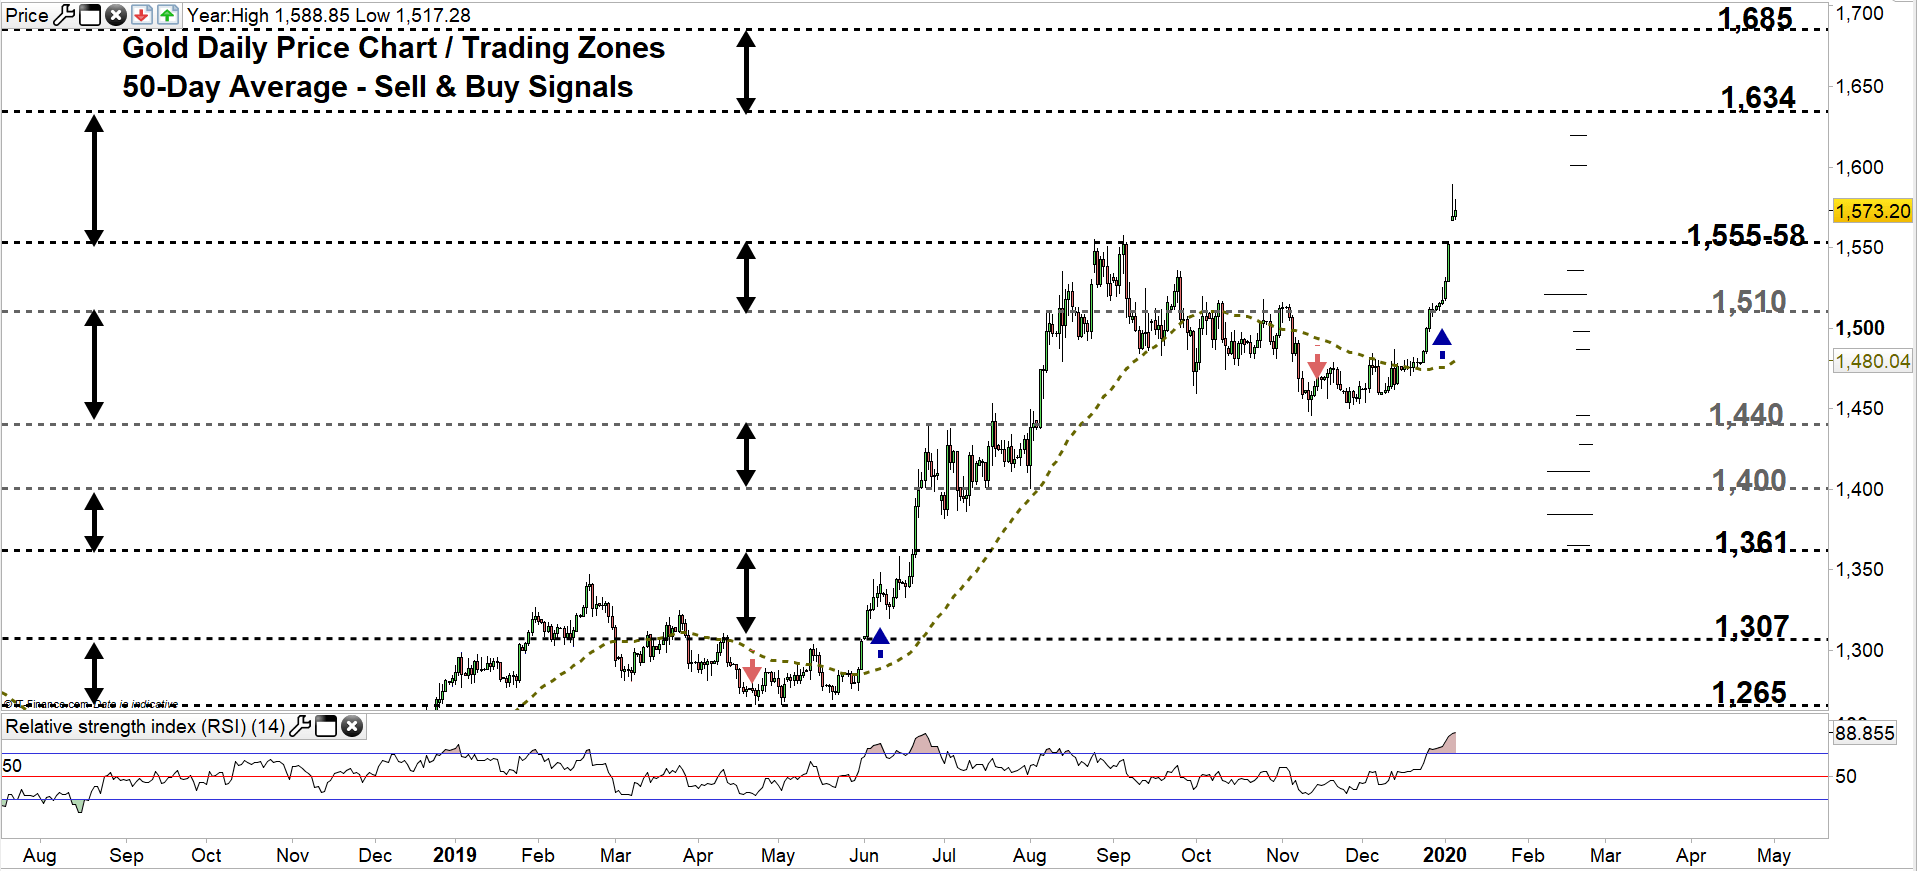
Gold DAILY PRICE CHART (MaY 31, 2018 – Jan 6, 2020) Zoomed out
Gold DAILY PRICE CHART (July 15 – Jan 6, 2020) Zoomed In

Looking at the daily chart, we notice that last week Gold rallied towards $1,555 as discussed in our last update. This week,Gold tested a higher trading zone $ 1,558- $1,634.
A close above the low end of the zone signals buyer’s intention to push XAU/USD towards the high end of the zone. Further close above this level may persuade more buyers to join the market and send the price towards $1,685. That said, the rally could weaken at the weekly resistance levels and area underlined on the chart as some buyers may take profit at these points.
On the flip side, any close below $1,555 reflects buyer’s exit from the market. This could lead XAU/USD towards $1,510. Further close below this level opens the door for sellers to take charge and press Gold towards $1,440. In that scenario, the daily and weekly support levels should be considered.

Gold Four-HOUR PRICE CHART (Oct 15 – Jan 6, 2020)

From the four-hour chart, we notice yesterday XAU/USD opened with a gap to the upside signalling the bullish sentiment in the market. Thus, a break above $1,601 could send XAUSUD towards $1,620. Although the weekly resistance level underscored on the chart should be kept in focus.
On the other hand, a break below $1,534 could press XAUUSD towards $1,517. Nevertheless, the daily support level marked on the chart should be monitored.
See the chart to know more about key levels Gold would encounter in a further bearish scenario.
Just getting started? See our Beginners’ Guide for FX traders
Written By: Mahmoud Alkudsi
Please feel free to contact me on Twitter: @Malkudsi


