Gold Price Technical Highlights:
- Gold breakout above March high failing
- A bit of support below around 1637/45 to watch short-term
Gold breakout above March high failing
Gold hasn’t been the easiest handle since the corona crisis hit markets, with it rising and falling in manners that caught many market participants off guard. It traded as both a risky asset and as it typically does in times of uncertainty, as a safe-haven.
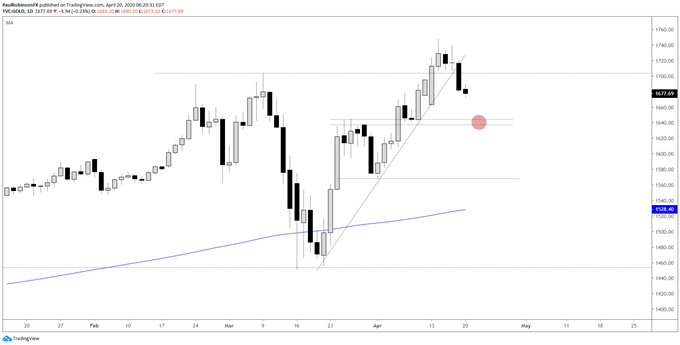
The recent breakout above the March high looked promising for gold to continue higher even though it looked a bit extended off last month’s low. But the breakout as of Friday is failing. The decline below 1703 also has price below the trend-line off the March low.
This opens up a path for more weakness in the near-term, with the confluent level breaking. The next level of support arrives around 1645/37, a high from late last month that held as support a couple of weeks back.
For those short-term traders looking for more downside there appears to be some room before shorts could get challenged. For would-be longs, a rejection from the 1637/45-area may offer a solid dip-buying opportunity with good risk/reward. If it breaks then further damage could result down below 1570.
Long-term, gold is in an uptrend and even a sizable drop from here won’t damage that. If anything it might provide a solid spot for longs to re-enter with more upside to be gained later on. The short-term picture is more doubtful, but as noted above there are levels to watch that can help shape trades with short time horizons.


Gold Price Daily Chart (below March high, 1645 could be next)

Gold Price Chart by TradingView
***Updates will be provided on the above technical outlook in webinars held at 1030 GMT on Tuesday and Friday. If you are looking for ideas and feedback on how to improve your overall approach to trading, join me on Thursday each week for the Becoming a Better Trader webinar series.
Resources for Forex & CFD Traders
Whether you are a new or experienced trader, we have several resources available to help you; indicator for tracking trader sentiment, quarterly trading forecasts, analytical and educational webinars held daily, trading guides to help you improve trading performance, and one specifically for those who are new to forex.
---Written by Paul Robinson, Market Analyst
You can follow Paul on Twitter at @PaulRobinsonFX


