

Gold/Silver Technical Outlook:
- Gold chart is getting a little ugly, but uptrend still in place
- Silver make expand on wedge break, shoot lower

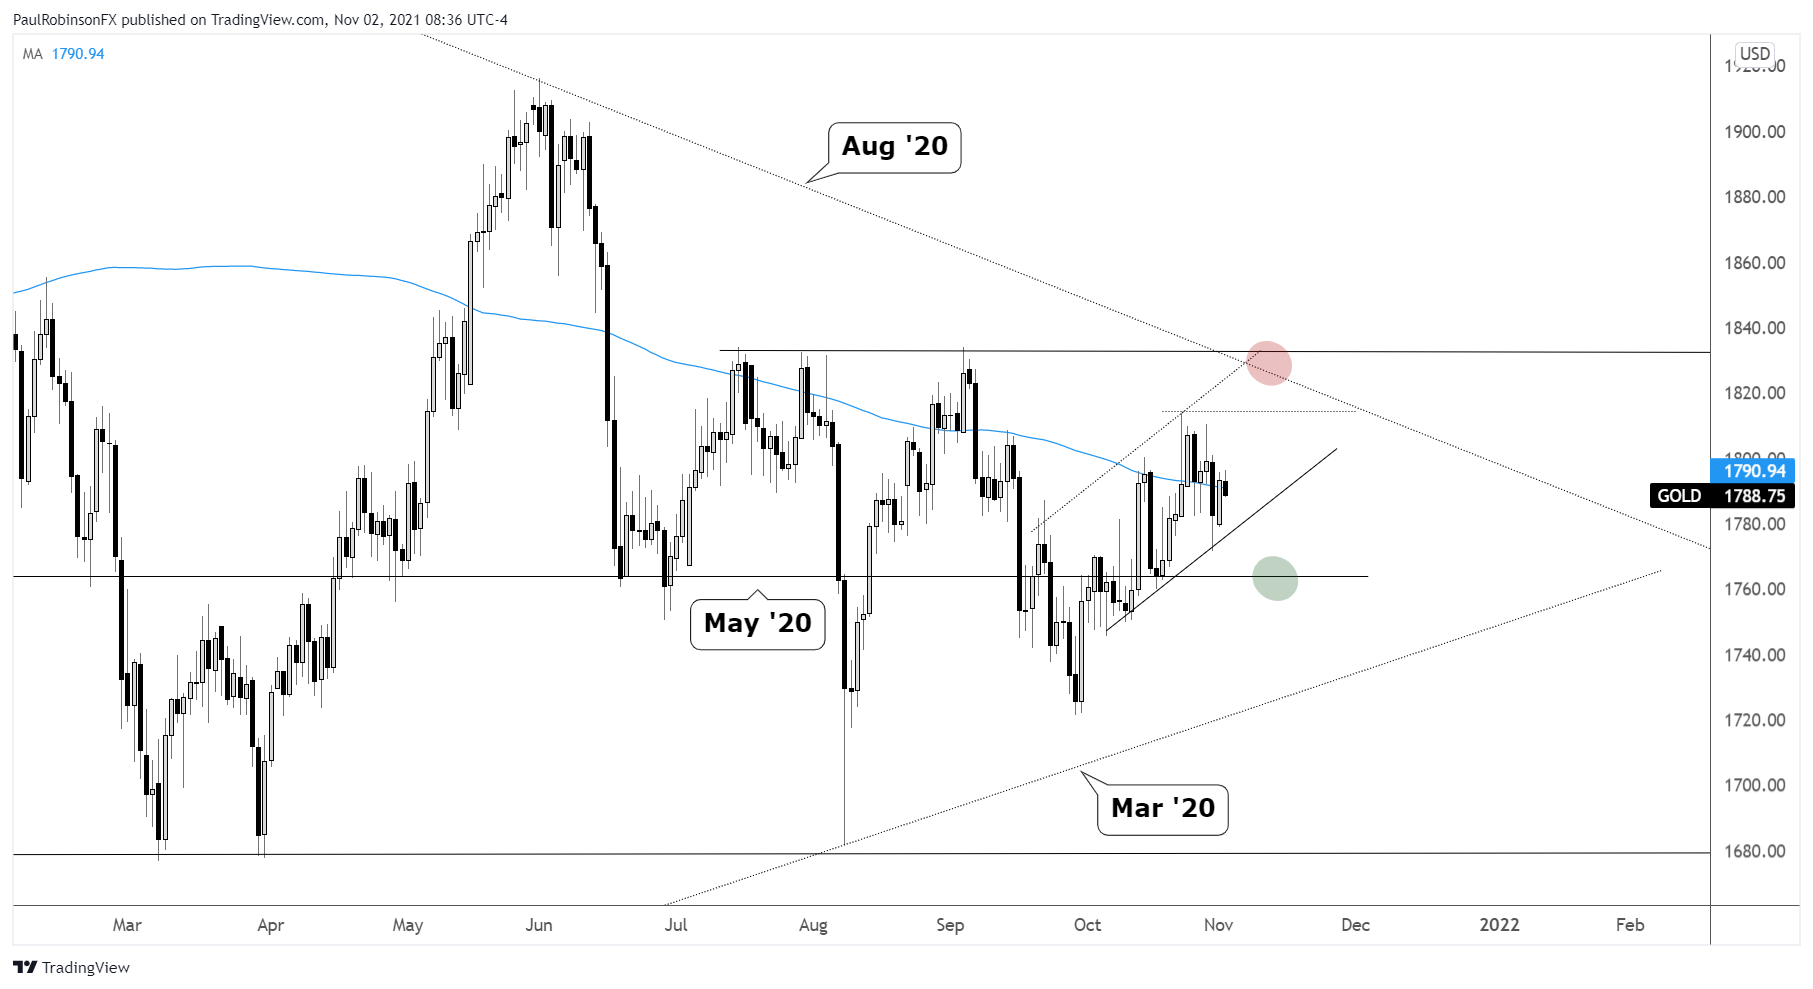
Gold price action has been a bit messy lately, with XAU making a hard break lower then quickly rebounding. The uptrend in place since September has been choppy, but still remains intact. Adding to the congestion is the 200-day moving average.
While there is some uncertainty surrounding the outlook, the trend is nevertheless still higher and should be respected. The trend-line from September broke but gold quickly found support at a slope from early October. The low created at that slope, 1771, will be used as a line-in-the-sand.
Stay above that low and the outlook is neutral at worst to bullish. Further strength from here will need to see price rise above 1813 before the larger test in the 1825-1835 area can happen. Up there lies a trend-line from August 2020 and multiple peaks created over the summer.
If we see price fall below, 1771, then the next level of support to watch comes in right around 1765, an area that has been in play numerous times since a peak in May 2020.

Gold Daily Chart
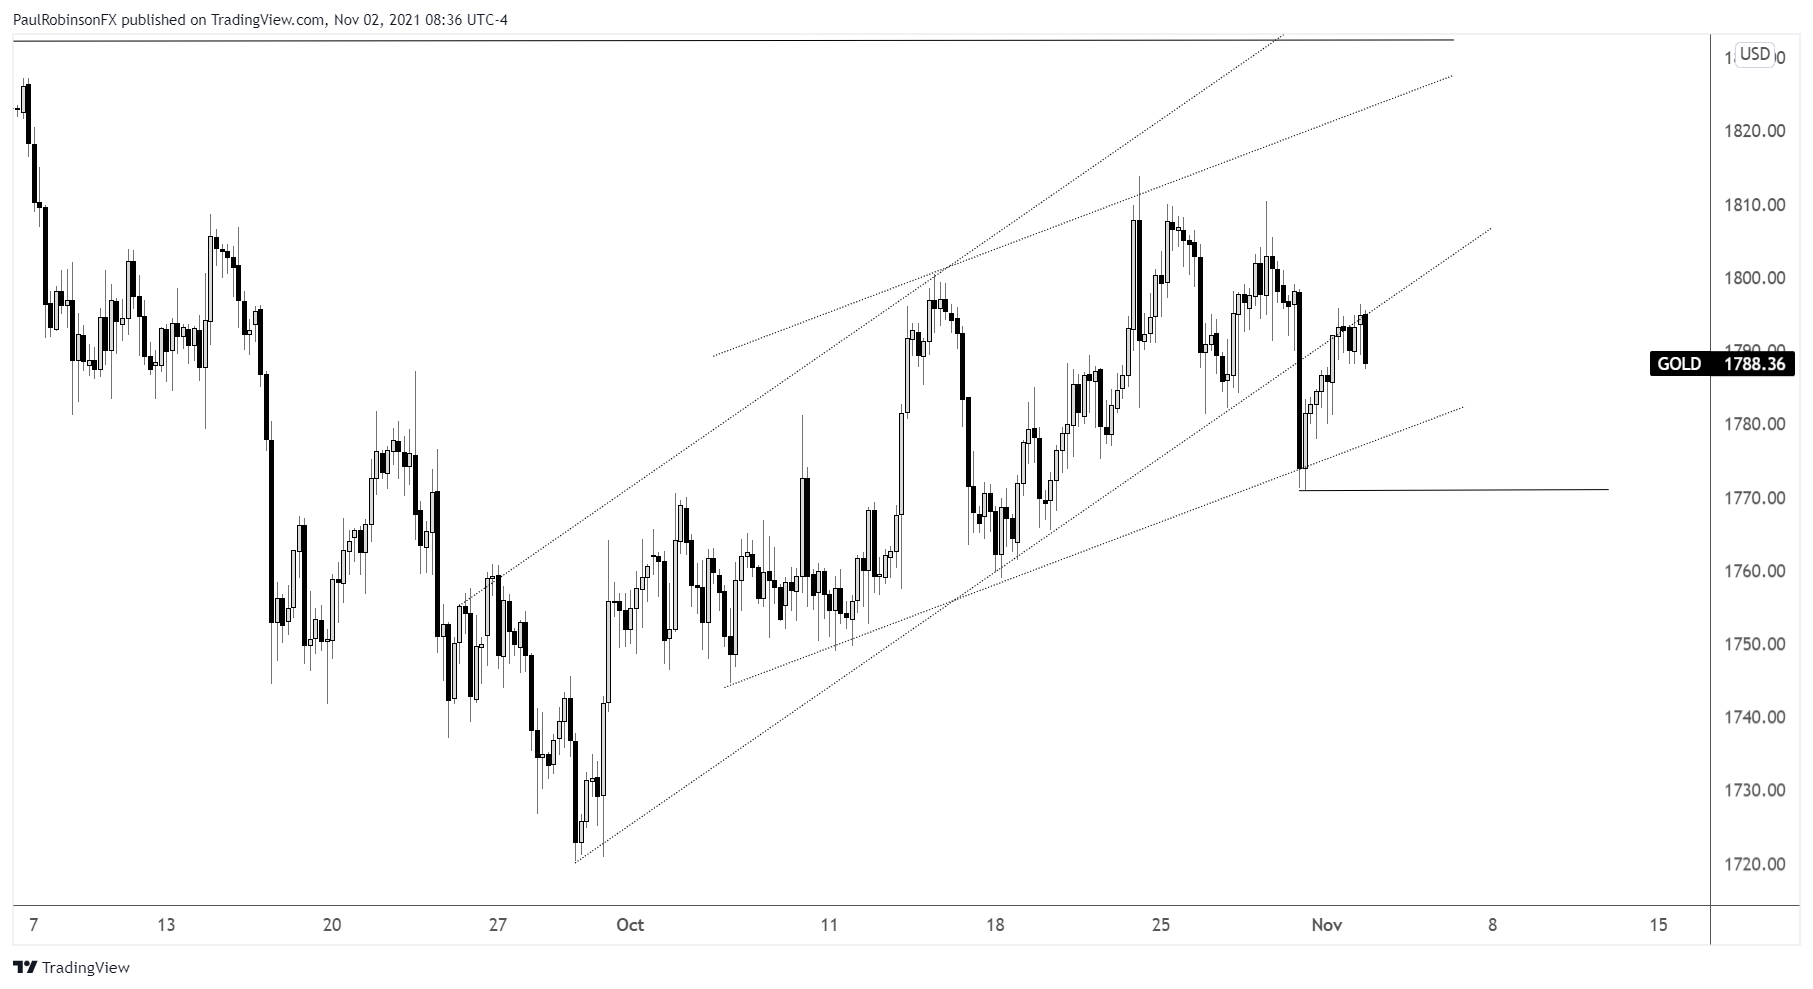
Gold 4-hr Chart
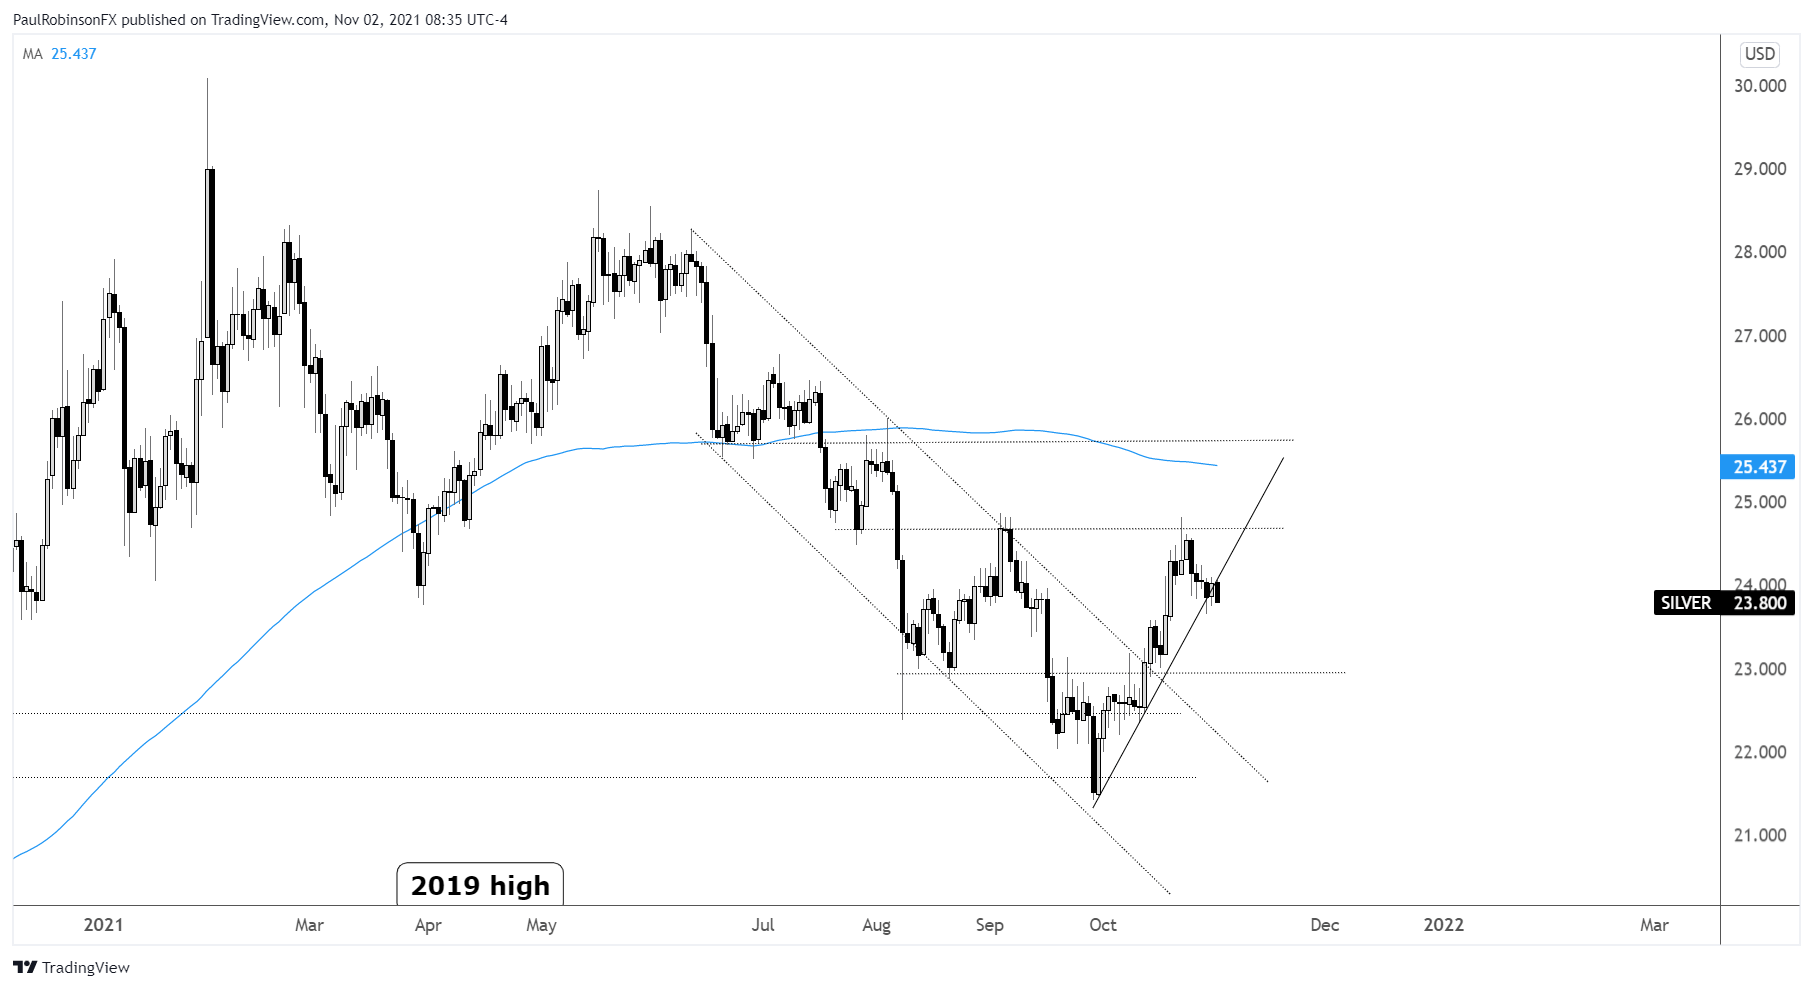
Silver continues to back down and press on trend support from late September. Price started to rise out of a descending wedge off trend-line support, but is now sinking lower, making the initial break higher potentially a false one. Confirming this would be a break of 23.63, that is seen as leading silver down to around 23 before the next level of support.
But as long as current support holds then silver remains in a neutral to bullish stance. Next level of meaningful resistance clocks in around 24.80.
Silver Daily Chart
Silver 4-hr Chart

Resources for Forex Traders
Whether you are a new or experienced trader, we have several resources available to help you; indicator for tracking trader sentiment, quarterly trading forecasts, analytical and educational webinars held daily, trading guides to help you improve trading performance, and one specifically for those who are new to forex.
---Written by Paul Robinson, Market Analyst
You can follow Paul on Twitter at @PaulRobinsonFX