

S&P 500, Dollar, USDMXN Points:
- Risk aversion escalated modestly this past session with the S&P 500 clearing a six-day range, but three-month trendline and 200-day moving average hold more weight
- Sentiment has soured as fear over the rise in COVID cases is starting to hit critical levels and the IMF has warned the 2020 global recession will be worse than expected in April
- Ahead, the Federal Reserve’s bank stress test results and IMF financial stability report are top scheduled event risk, but the Mexican and Turkish central bank decision should be monitored
A Shift Towards Risk Aversion but Not Yet the Avalanche
Sentiment took a threatening turn Wednesday through the US session, but it isn’t yet signaling a self-sustaining collapse in risk appetite. That said, if the rise in coronavirus cases converges inextricably with the unrelenting downgrades in the global growth forecasts, we may find speculative appetites slaked through the foreseeable future. Since there is considerable ambiguity around fundamental concerns when it comes the masses, many default to the charts. I am a firm believer that the best reading for a definitive risk trend is the combination of correlation and intensity in momentum across a range of speculative benchmarks. However, if I was pushed to pick a one-look measure, the S&P 500 or Dow would be a top-of-list measure. The SPX broke through the floor of its 6-day range Wednesday, but the more significant technical support lies around 3020 as the confluence of a three-month trendline support and 200-day moving average.
| Change in | Longs | Shorts | OI |
| Daily | 2% | 2% | 2% |
| Weekly | 2% | 3% | 3% |
Chart of the S&P 500 with 100 and 200-Day Moving Average and 6-Day Range (Daily Chart)
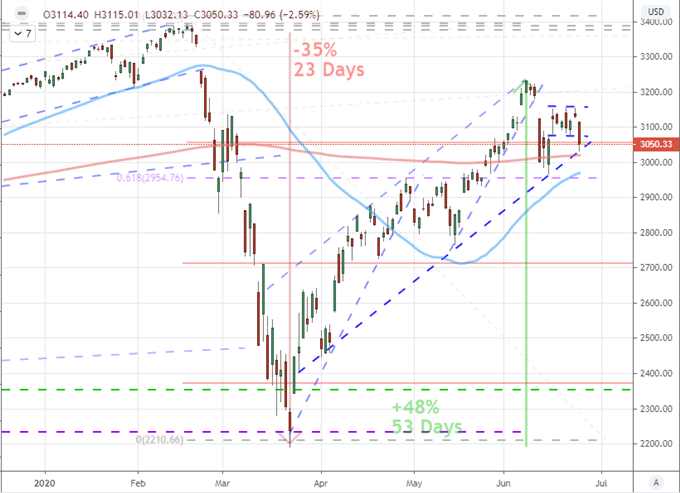
Chart Created on Tradingview Platform
With the consideration of ‘intensity’ to help gauge potential for consistency in risk trends, it is worth looking at havens as well that are better tuned to nuance. The US Dollar is once such measure. The renowned haven has spent more time as a haven of last resort over the past years thanks to the considerable carry advantage it held through 2019. That has changed however, with the currency showing greater responsiveness to moderate levels of risk aversion. While its sensitivity has increased, I will still look to the US currency for full risk appetite. In particular USDJPY can given insight with the carry unwind a favor of the Yen while sheer liquidity benefits the Greenback.
Chart of the DXY Dollar Index and Inverted S&P 500 Emini (4 Hour)
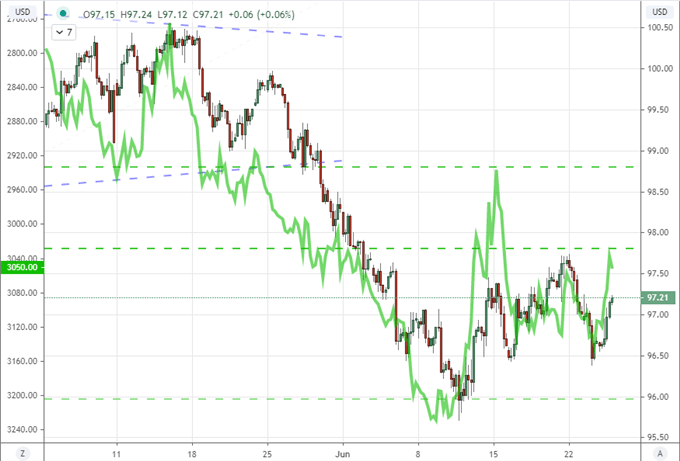
Chart Created on Tradingview Platform
The Fundamental Detonators to Watch More Closely
While collective risk appetite – bullish or bearish – is ultimately what dictates the larger trends in the market for me, the drive is best established through a fundamental theme that that has universal appeal – or otherwise stokes global fears. A second wave of the pandemic is one such risk that can align the bears. Headlines covering a rise in cases is a global phenomenon, but the situation in the United States is particularly acute. Wednesday, reports of cases in Oklahoma, Florida, California and Texas offered points of worry. As the repots of cases rise in more than half of states, the burden on hospitals presents a threat of a tipping point for possible economic shutdowns that can circumvent the Federal government’s intention to avoid a nationwide shutdown.
Graph of US Cases of Coronavirus (Daily)
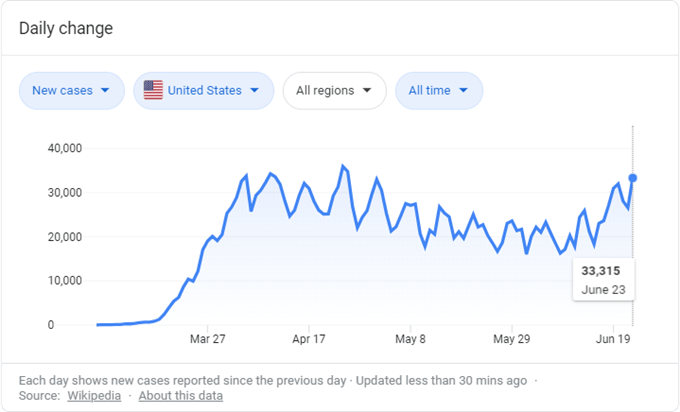
Chart from Google with Data from Wikipedia
If coronavirus cases were the only headline on tap this past session, we perhaps wouldn’t have seen the break from the S&P 500’s range. However, there was another serious update on the headlines. The IMF updated its global growth forecasts through the session to remind us that there is an economic toll from the health crisis. If we were to consider the attention paid to critical themes as a proxy for the impact it can carry on the market, a reference to the global growth search interest in “stimulus” relative to “COVID” should tell us something.
Chart of Google Search Ranking for ‘Stimulus’ and ‘COVID’ (Weekly)
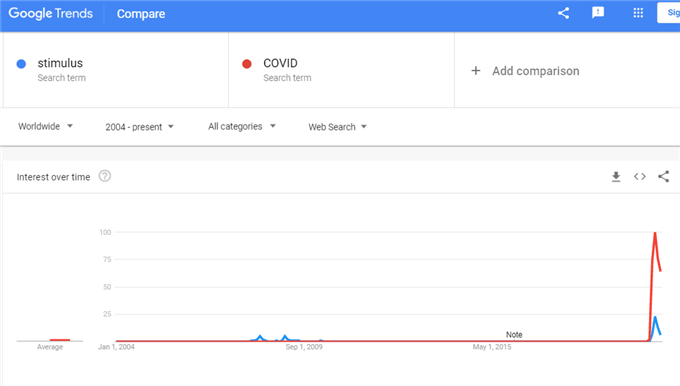
Chart Created on Google Trends
As for the growth outlook, the IMF’s expectations took a severe dive from the April update. If we were to go by the market’s take on their forecasts March/April seemed to bring the worst of the expectations. The subsequent recovery in capital assets and upswing from data like PMIs and sentiment surveys in recent months would seem to signal that the outlook has improve materially. The IMF doesn’t seem to buy into that optimism. The June WEO (World Economic Outlook) revised the 2020 recession forecast from a painful -3.0% contraction in global GDP to a staggering -4.9%. If these pessimistic – I’d say realistic – views catch traction, record high Nasdaq 100 levels would look very distorted.
Table of Major Economies and Regions Growth Forecasts from IMF’s WEO
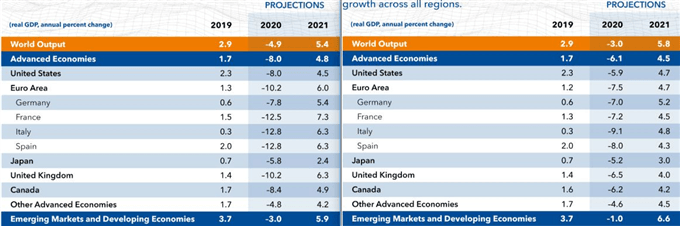
Tables from IMF
Ahead: Central Bank and Financial Stability Measures to Watch
If you’re look at the course ahead through Thursday, it is of course important to monitor developments around the cononvirus and recession fears. More likely than not, we will be revisiting these matters in price action if not headlines. Yet, if you are looking for scheduled events, the top listing on my docket is the Federal Reserve’s bank stress test results. This review has an additional three scenarios to account for: the potential for a ‘V-shaped’, ‘U-shaped’ and ‘W-shaped’ recovery. Depending on what the base case may be and the fallout prescribed, this could prove a unsettling reminder for US and global assets.
Chart of the TED Spread – 3 Month US Libor to 3 Month US Treasury Rate (Weekly)
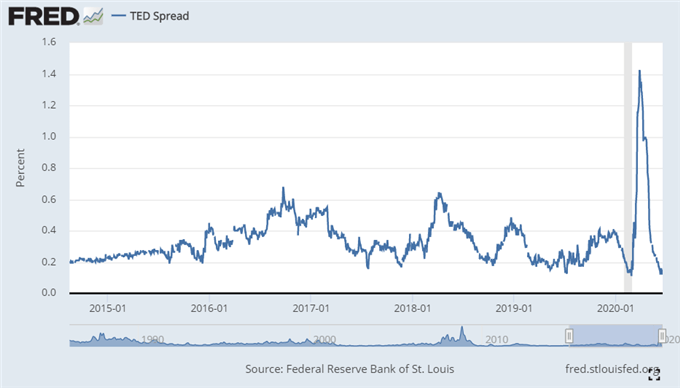
Chart from Federal Reserve Economic Database
In similar global terms, the IMF’s Global Financial Stability Report (GFSR) can capture the attention of investors the world over – particularly in a negative way. That said, if we are looking for more targeted event risk for volatility, I plan to keep tabs on the central bank decisions from Mexico’s and Turkey’s central banks. The former is expected to cut rates 50 basis points and the latter 100 basis points. As emerging market / carry currencies, this can take a tool on speculative interest. Then again, will economic confidence hold without more support? Watch USDMXN and USDTRY through these events.
Chart of USDMXN with 50-Day and 200-Day Moving Averages (Daily)
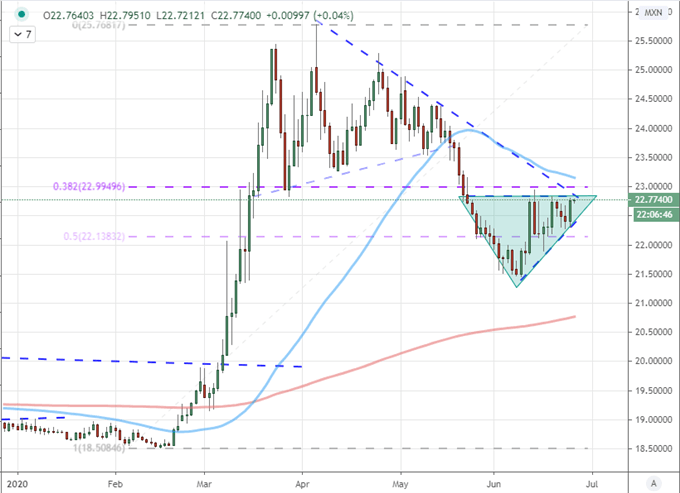
Chart Created on Tradingview Platform

If you want to download my Manic-Crisis calendar, you can find the updated file here.
.