


WTI crude oil is quickly approaching a major long-term threshold via the 2008 trend-line, but also has other forms of resistance in the area, too, which could make the days ahead very important. Gold broke down out of a tight trading range, but is now ignoring dollar strength and trying to trade back higher. More volatility is to be expected this month, but outlook shrouded by choppiness. The S&P 500 continues to hold onto trend-line support, but if it breaks expect at least some mild weakness.
Technical Highlights:
- Crude oil trading towards 2008 trend-line, sentiment overly bullish
- Gold broke bottom of range and back inside, watch the top side
- S&P 500 tip-toeing trend-line support, a break would be mildly negative
See how the majority of traders are positioned in various markets/currencies and what it says about future price fluctuations – IG Client Sentiment
Crude oil trading towards 2008 trend-line, sentiment overly bullish
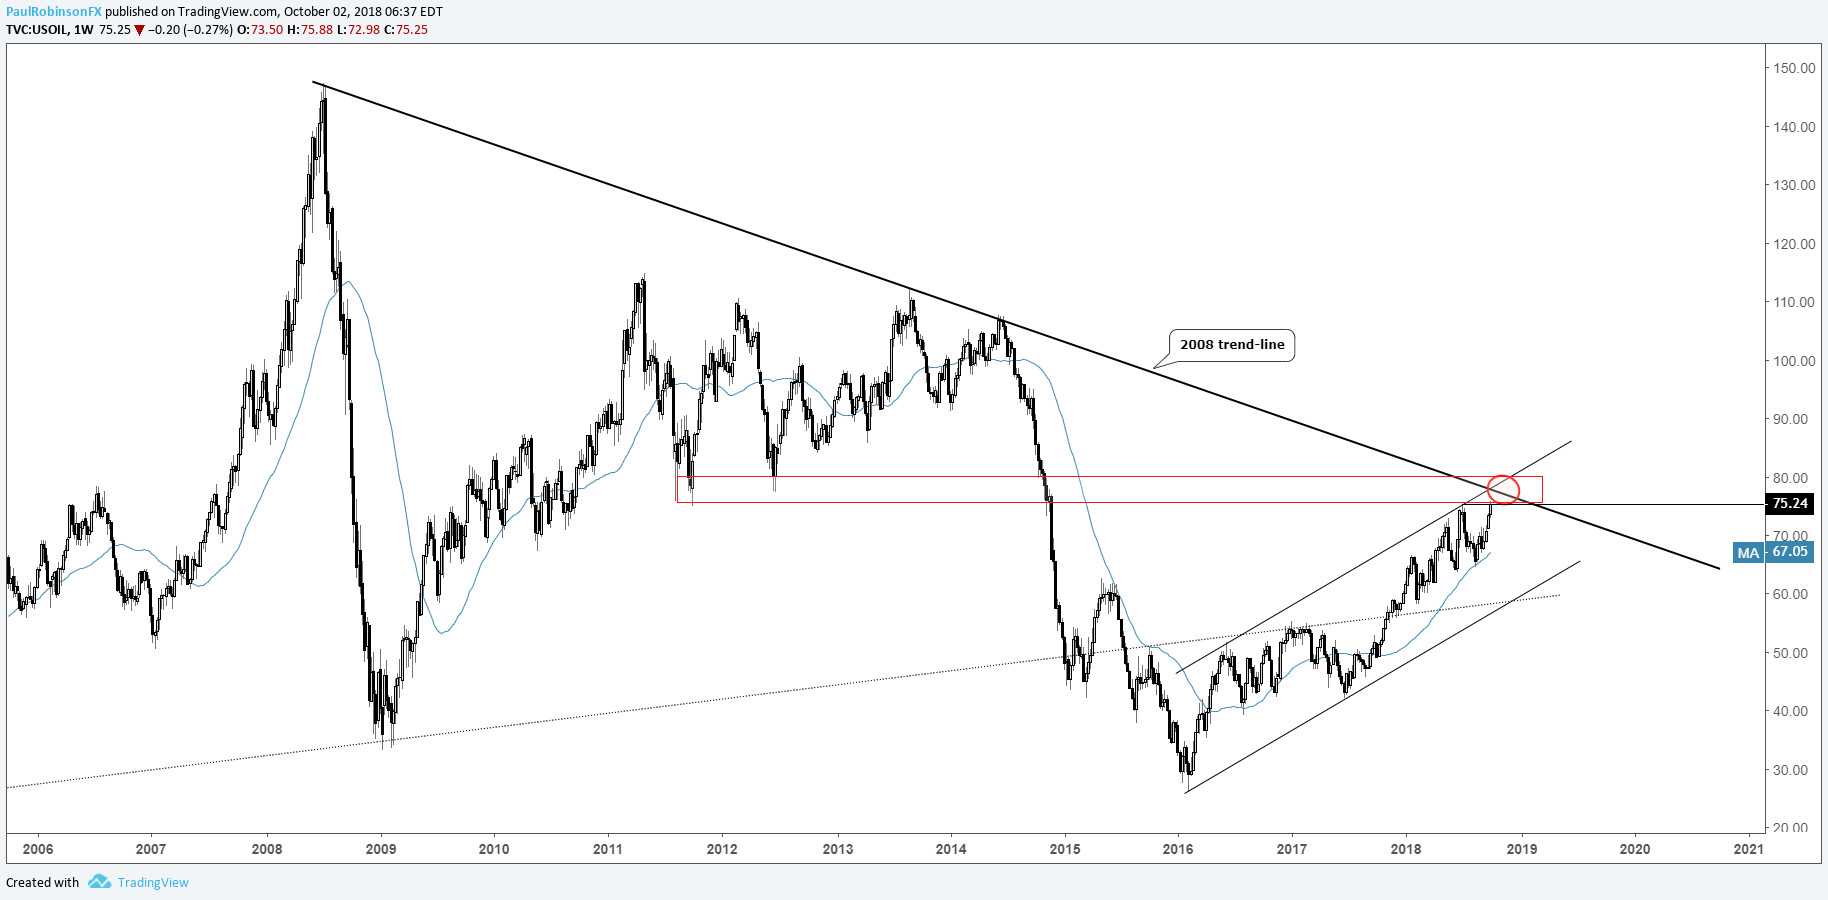
Crude oil is quickly approaching a very important area of resistance. For starters, and most importantly, there is a trend-line running down off the 2008 high. But also, in the vicinity are lows created during 2011 and 2012. Of lesser importance, the top-side slope of the bull-move off the 2016 low arrives around the 2008 trend-line.
All of this makes for a big spot and the market is fully charged up as we approach. Looking at one sentiment metric in the futures market, the Daily Sentiment Index (DSI); it is reaching into the mid-90% range in terms of bullishness. These are rare readings and suggest the market is ripe for a reversal. Couple major long-term levels with an overly bullish market and indeed it looks like some kind of top is coming.
With conditions in place we’ll turn to the final arbiter – price. Watching for some type of volatile turnabout in price action will be the key to jumping aboard a turn lower. But keep in mind, a turn down probably won’t come all at once. The persistent trend is not likely to die quickly. But nevertheless, shorts should start to gain the upper hand even in the near-term as the market runs out of fuel. We’ll certainly be discussing oil more frequently in future webinars.
WTI crude oil Weekly Chart (Lots of Resistance)
For our intermediate-term fundamental and technical take, see the Q4 Crude Oil Forecast
Gold broke bottom of range and back inside, watch the top side
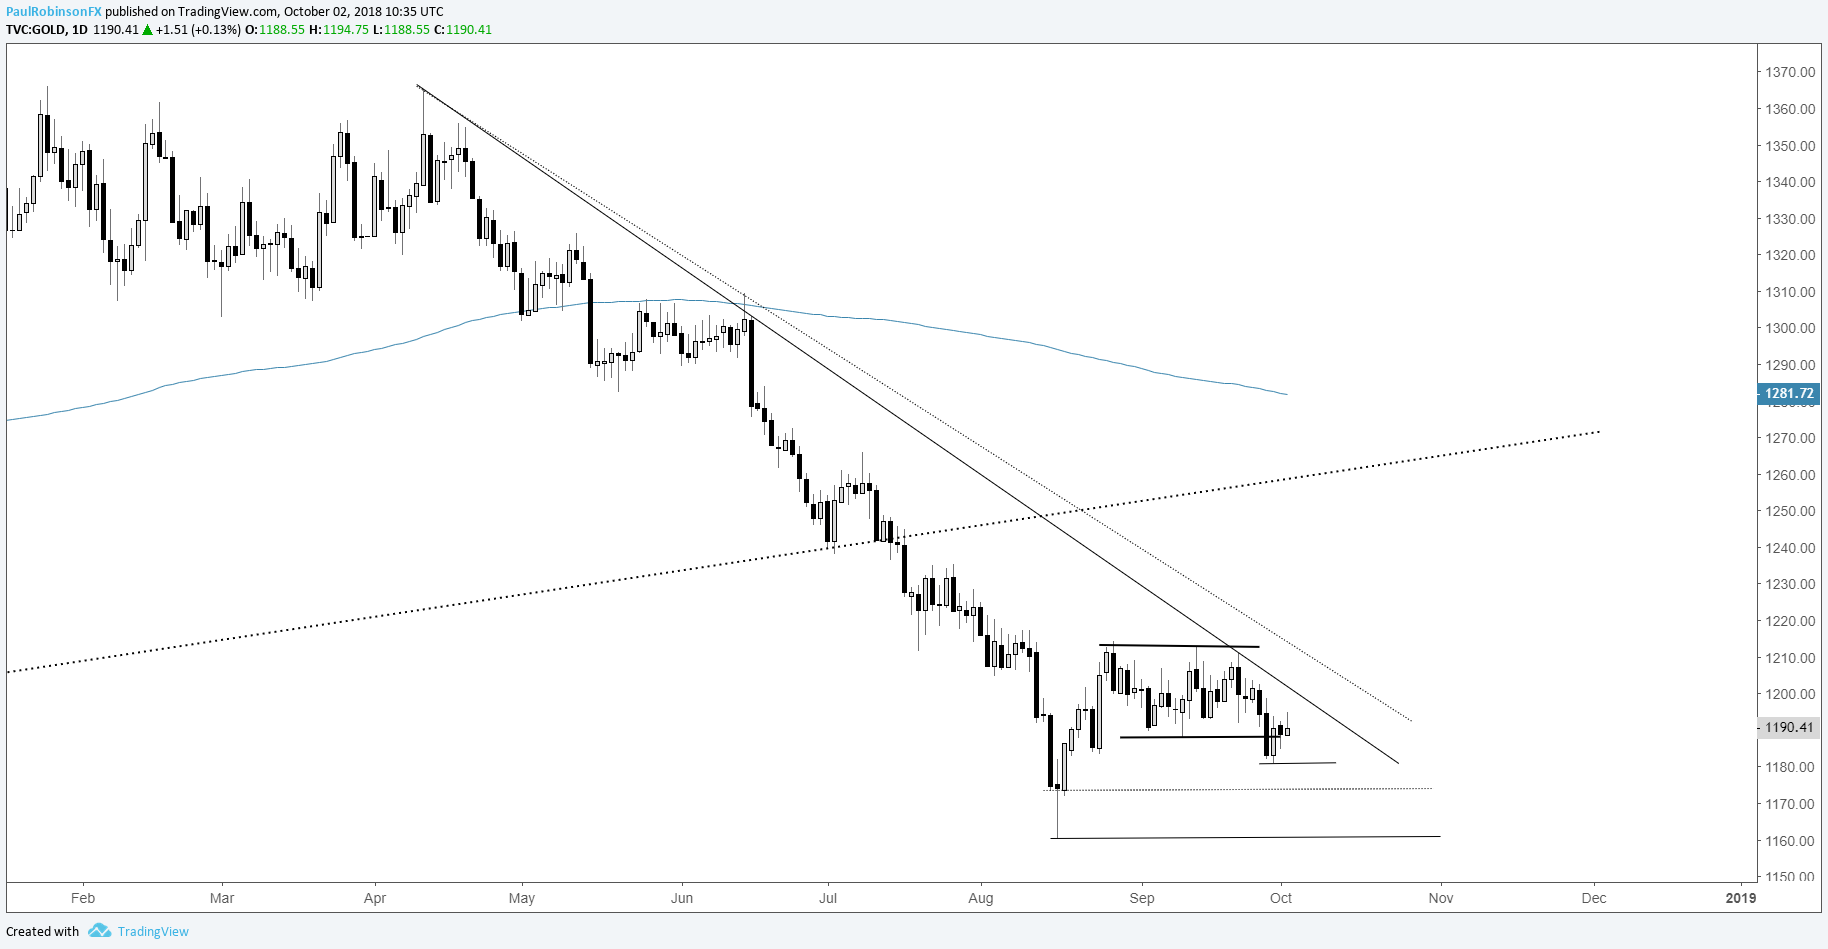
Gold has been a difficult handle, with last month’s range an extremely tight one. Last week, gold broke down out of the range, but only briefly. The scenario of breaking down and quickly finding a low is one we discussed last week, and with gold trading back inside the range risk is becoming skewed towards a false breakdown leading to a rally. On a side note, gold isn’t responding much to dollar strength which may turn out to be a silver lining for gold. But overall, price action isn’t very favorable and generally leaning towards avoiding the precious metal altogether.
Gold Daily Chart (Reversed back inside range)
For our intermediate-term fundamental and technical take, see the Q4 Gold Forecast
S&P 500 tip-toeing trend-line support, a break would be mildly negative
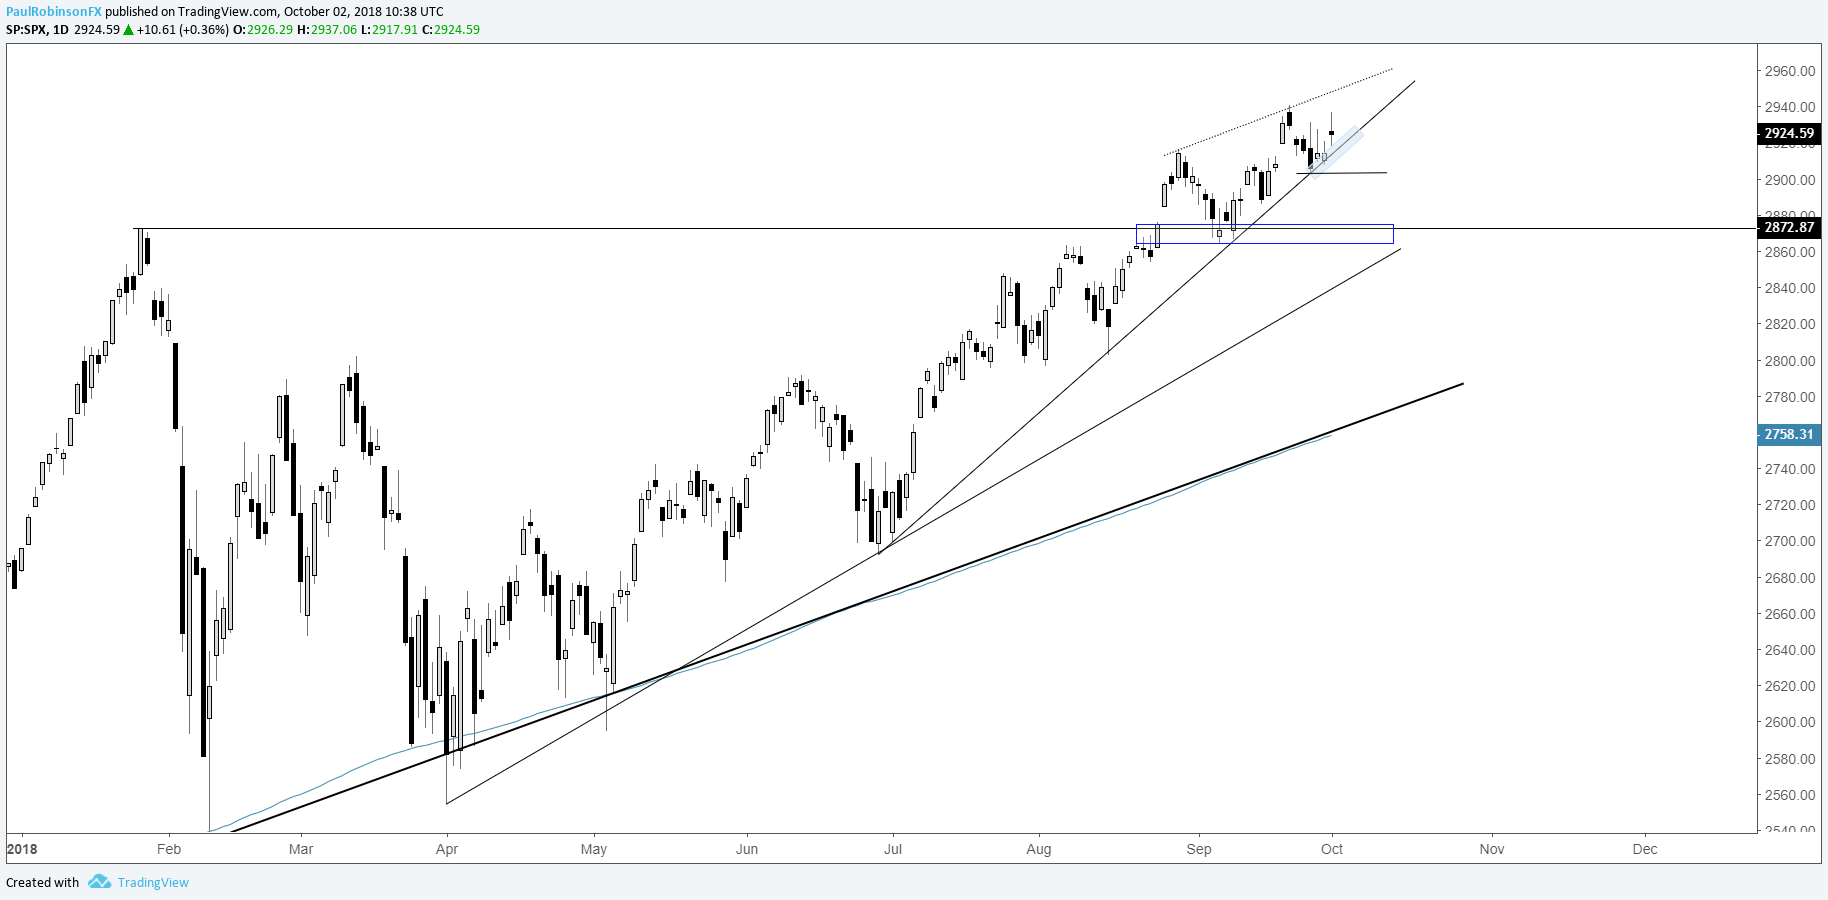
The S&P 500 is given the benefit of the doubt within its uptrend, but with it repeatedly pressing on trend support a bullish outlook is at risk of souring. The trend-line from June is to be respected until broken and can be a guide for both sides of the market. Stay above and no reason to look for lower prices, break through and minor weakness could set in. As it stands right now, overnight futures have the market to open right around support.
S&P 500 Daily Chart (T-line Support)
For our intermediate-term fundamental and technical take, see the Q4 Global Equities Forecast
Resources for Index & Commodity Traders
Whether you are a new or an experienced trader, DailyFX has several resources available to help you; indicator for tracking trader sentiment, quarterly trading forecasts, analytical and educational webinars held daily, trading guides to help you improve trading performance, and one specifically for those who are new to forex.
---Written by Paul Robinson, Market Analyst
You can follow Paul on Twitter at @PaulRobinsonFX


