


US Dollar Talking Points:
- Tomorrow brings the widely-awaited March FOMC rate decision, where the bank is expected to hike rates for the first time since 2018.
- While a 25 basis point cut feels fairly baked-in here the bigger question is what else the Fed has in store for 2022. Markets are expecting a median of 7 hikes this year, but the yield curve has already made a fast move towards inversion. The Fed appears to be backed into a corner where they have no choice but to hike later in the year, even in a possible recessionary environment. Tomorrow will give us insight into where they feel they are and how they might handle it. The projections and the press conference will likely be significantly more important than the 25 bp hike.
- The analysis contained in article relies on price action and chart formations. To learn more about price action or chart patterns, check out our DailyFX Education section.
Trade Smarter - Sign up for the DailyFX Newsletter
Receive timely and compelling market commentary from the DailyFX team
Fed day is finally here, well, tomorrow that is. And at this point there’s been so much consternation around this meeting that there’s no real mystery to what might be announced on the rate front, with markets geared up for a 25 basis point hike from the Fed.
But this is unlikely to solve any problems as last week’s CPI came in at another 40-year high of 7.9% and now there’s a host of concerns around price jumps in raw materials that will likely continue pushing on inflation in the coming months, even as the Fed tries to tighten monetary policy.
Of recent, there has been a bit of possible hope for those commodity price moves in a very bizarre place. Oil prices are getting hit again this morning as China has locked down Shenzhen as Covid cases continue to rise. And, logically, this may not be the last place that China locks down as they’ve remained very vigilant in responding to Covid.
From a commodity perspective this may help a bit in the near-term as diminished consumption could hit demand, which could soften the hit from supply concerns. But, there may be an even bigger issue that this brings as China shutting down, particularly in a major production center like Shenzhen, is probably only going to create more supply chain concerns. So, that, too, may end up being another factor to push inflation even higher, even if it is showing a respite in commodity prices today.
These are all concerns that the Fed is going to have to face up to at some point this year, and it puts more and more emphasis on their stance last year when saying that inflation was ‘transitory.’ So this is a problem that was really created by the bank’s negligence in dealing with the issue last year when inflation was running at 4, 5 and 6 percent.
A big question for tomorrow which may not be directly spoken to, is where is the Fed put? Or, does it no longer exist? Each of this inflation dominos could help to erode that support that market participants have become so accustomed to since the Global Financial Collapse, because for the first time since, inflation is a major concern and the Fed is in a defensive posture.
The US Dollar
The US Dollar remains very near a big spot of confluent resistance. The level of 99.34 is the 14.4% retracement of the 2011-2017 major move, and this price caught the highs in DXY last March. That led to a pullback with support showing up at a prime spot on the chart, spanning from 97.72-97.87 . I highlighted this level last Monday before it came into play and again on Thursday after showing up as support around the release of CPI.
After that quick probe of support, price action immediately jumped back up to this major resistance, giving the impression that bulls may go for a break here.
US Dollar Daily Price Chart
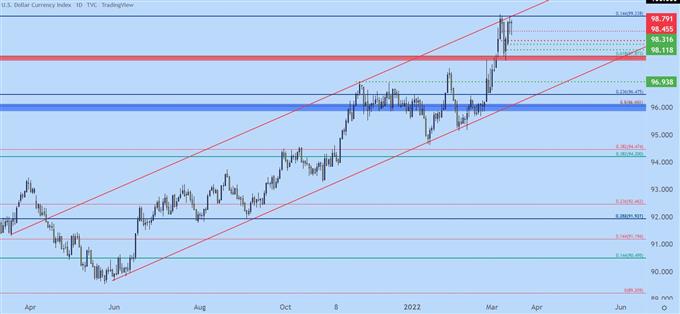
Chart prepared by James Stanley; USD, DXY on Tradingview
US Dollar for Tomorrow – Bullish
I’m bullish USD from both fundamental and technical factors. The primary drawback to strength at this point is resistance. But, tomorrow brings a major driver to the fray that could compel bulls to push.
But even if they don’t, I’m likely going to retain a bullish stance, looking for price to pull back towards support if the Fed can, somehow, bring a push of USD weakness into the mix.
For short-term support, there’s a spot between 98.32 and 98.45 that’s of interest. The longer-term zone runs below that, from 97.72-97.87.
US Dollar Four-Hour Price Chart
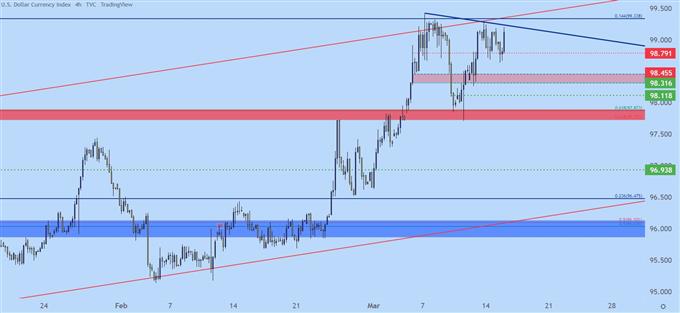
Chart prepared by James Stanley; USD, DXY on Tradingview
EUR/USD
I remain bearish on EUR/USD and the fundamental divergence from the U.S. can continue to push this dynamic in 2022 trade. We heard from the ECB last week and there not close to a rate hike at this point. EUR/USD had a strong reaction around that, which was on the same morning as CPI, flickering up to resistance around 1.1104-1.1140 before resuming its descent.
At this point, support remains at a long-term Fibonacci level just above the 1.0800 handle, and that led to 300-pip bounce that’s slowly been eroding over the past few trading days.
This morning brought a resistance inflection off of the long-term trendline projection and this keeps the door open for an extension of lower-lows and lower-highs.
Near-term resistance remains at 1.1000, 1.1057 and then 1.1104-1.1140.
EUR/USD Four-Hour Price Chart
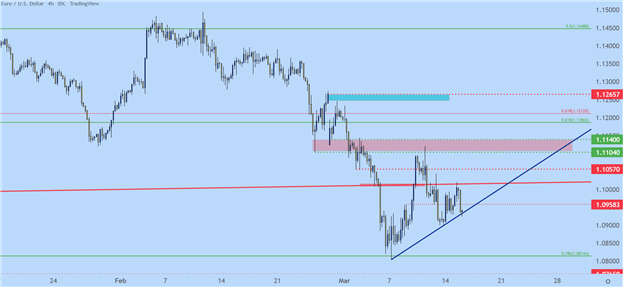
Chart prepared by James Stanley; EURUSD on Tradingview
GBP/USD
I had been bearish on GBP/USD since last month and I diagrammed this in the last webinar, highlighting a deduction that showed possible GBP weakness on the horizon.
The pair has since broken down by more than 500 pips. Eventually finding support at the 1.3000 big figure.
This could possibly make for a reversal scenario as an oversold market just re-engaged with a major spot of support at 1.3000. The fundamental backdrop in the U.K. isn’t quite as dire as Europe, as there is the potential for actual rate hikes out of the BoE this year.
But, key for reversal scenarios coming alive will be a continued push from bulls. We’ve already seen a short-term higher-high print and at this point, we need to see the higher-low we don’t yet have that. But, this is a theme that could come alive over the next 24 hours, particularly around the FOMC if we do see a bearish reaction in the USD.
GBP/USD Hourly Price Chart
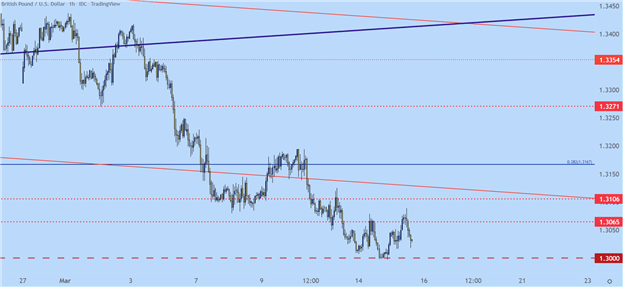
Chart prepared by James Stanley; GBPUSD on Tradingview
USD/CAD Range Expansion, Breakout Potential
In USD/CAD the pair spent about a month in a textbook range. But, as a number of markets launched higher/lower in late-February as Russia invaded Ukraine, the range in USD/CAD began to stretch on both sides, showing price action expansion with a megaphone formation.
USD/CAD Eight-Hour Price Chart
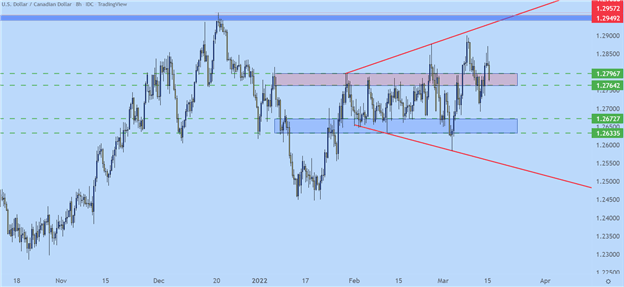
Chart prepared by James Stanley; USDCAD on Tradingview
Longer-term, however, there remains some bullish potential for the pair and this is something that could come to light in the coming weeks, particularly in a bullish-USD scenario.
From the weekly chart below, we can see an ascending triangle formation. This is a bullish breakout formation and resistance is at a key spot of 1.2950-1.3000. This keeps the focus on the long side of the pair.
USD/CAD Weekly Price Chart
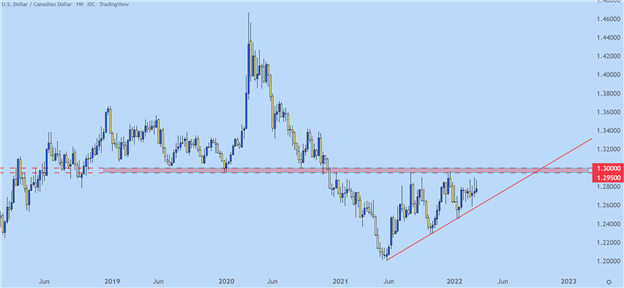
Chart prepared by James Stanley; USDCAD on Tradingview
AUD/USD
Aussie was one of my main candidates for USD-weakness over the past month.
In early-February the pair found support at the .7000 psychological level while brewing a falling wedge formation, often followed for bullish reversals.
Mid-month prices were already testing resistance, and by the last full week of February prices were already breaking out of that formation.
That led to a strong breakout, even as the USD was in the midst of its own breakout. Price action in AUD/USD eventually found support on the underside of a prior bear flag formation, and that led to a pullback to the .7250 psychological level, which I was plotting for support. And while this did give a reaction, the pair failed to re-test the prior high and has since sunk down to fresh near-term low.
At this point, prices are at the 38.2% retracement of the November-February sell-off, so there is still some bullish potential here, but buyers are going to need to respond quickly to keep that theme in workable order.
AUD/USD Daily Price Chart
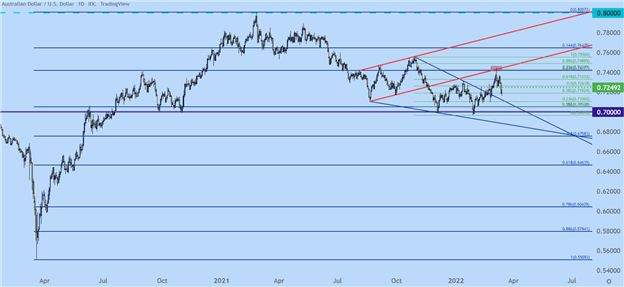
Chart prepared by James Stanley; AUDUSD on Tradingview
--- Written by James Stanley, Senior Strategist for DailyFX.com
Contact and follow James on Twitter: @JStanleyFX


