


Market Recap
Slowing growth in the US services sector and a significantly lower-than-expected US private payroll data paved the way for some cooling in the US Treasury yields rally, which offered room for relief in Wall Street overnight.
The US Automatic Data Processing (ADP) payroll data totalled just 89,000 in September versus the 153,000 forecast, and while it may not necessarily go hand-in-hand with the official non-farm payroll data released Friday, rate expectations were quick to pare back on some hawkish bets. This also comes as the US services purchasing managers index (PMI) data softened to 53.6 from previous 54.5, while new orders registered its lowest level since December (51.8 vs 57.5 forecast).
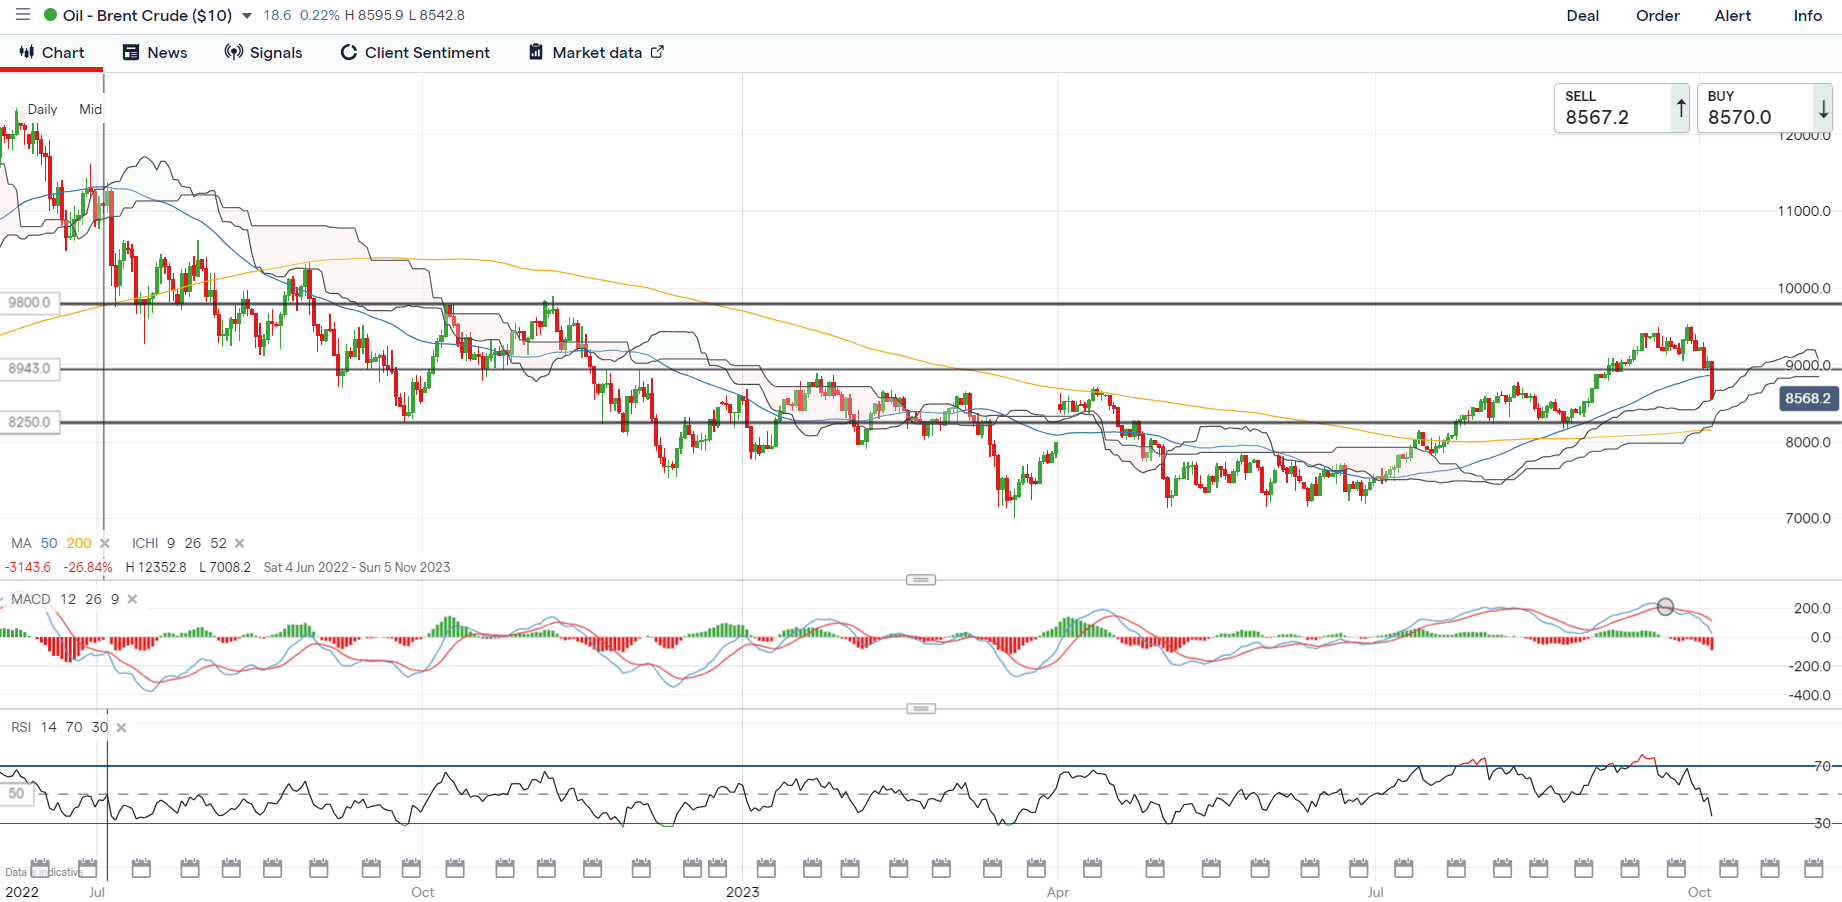
The S&P 500 VIX has retraced off the 20 level for now, which marked a key level of resistance from its May 2023 high, although overall risk mood may likely stay cautious in the lead-up to the US non-farm payroll data to end the week. Much attention is on oil prices, with Brent crude seeing a 5.4% plunge overnight. Despite another week of higher-than-expected drawdown in US crude inventories, traders have their focus on the significant build in gasoline inventories (+6.5 million vs +0.2 million expected).
A decisive break below its 50-day moving average (MA) for Brent crude prices could leave sellers in control for now, while its daily Relative Strength Index (RSI) heads to its lowest level since May this year. The US$82.50 level may serve as a key level for buyers to defend next, where the lower edge of its Ichimoku cloud on the daily chart rests alongside its key 200-day MA. Having reclaimed its 200-day MA back in July this year for the first time in 11 months, the MA-line may be a key level of support to retain the broader upward trend.

Source: IG charts
Asia Open
Asian stocks look set for a positive open, with Nikkei +0.66%, ASX +0.09% and KOSPI +0.28% at the time of writing. Lower Treasury yields, a weaker US dollar and falling oil prices may allow risk sentiments in the region to stabilise from its recent sell-off, although there is still some caution around risk-taking being presented.
China markets remain closed for the rest of the week, while the Hang Seng Index touched a new low since November 2022 in yesterday’s session. Economic data this morning saw a higher-than-expected inflation read from South Korea (3.7% versus 3.4% forecast), with the second straight month of increase likely to keep the Bank of Korea on its hawkish pause at its 19 October meeting, leaving room for additional tightening but still on further wait-and-see for now.
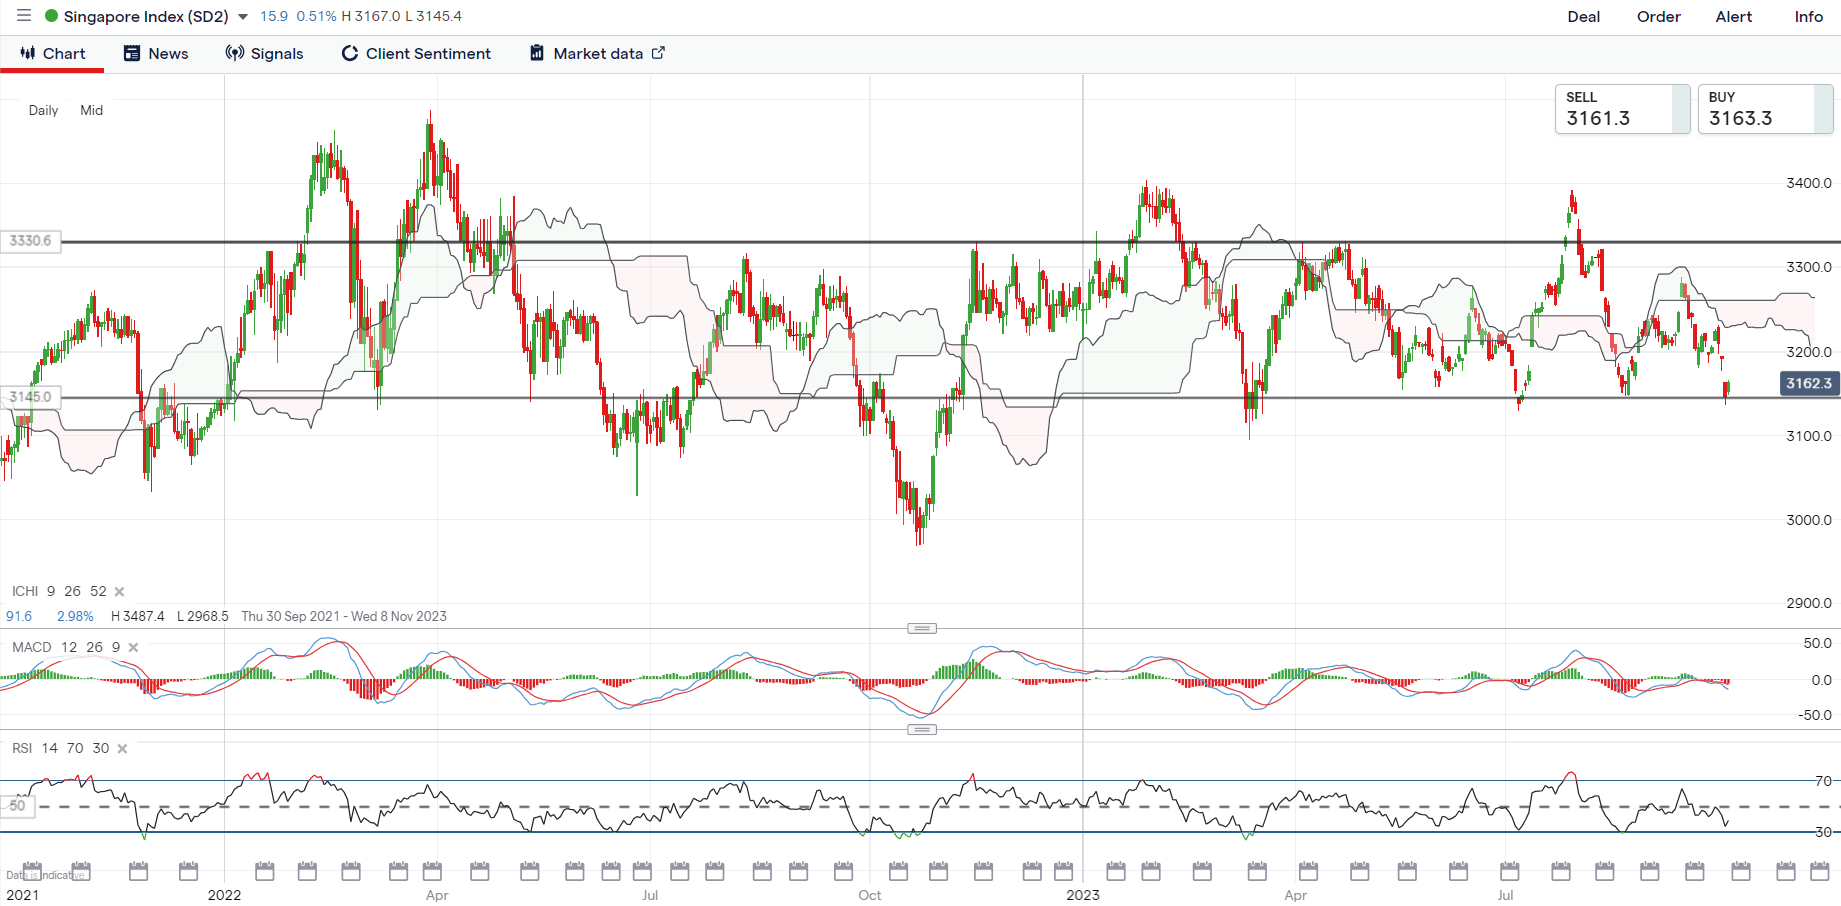
Aside, the Straits Times Index may be on the radar, with the index back at the lower base of its long-ranging pattern, which may prompt some defending from buyers ahead at the 3,145 level. Greater conviction may still be needed from a move in the daily moving average convergence/divergence (MACD) back above the zero mark, alongside the daily RSI above the 50 level. A successful defend of the 3,145 level may leave the 3,230 level on watch next.

Source: IG charts
On the watchlist: Natural gas prices touch eight-month high
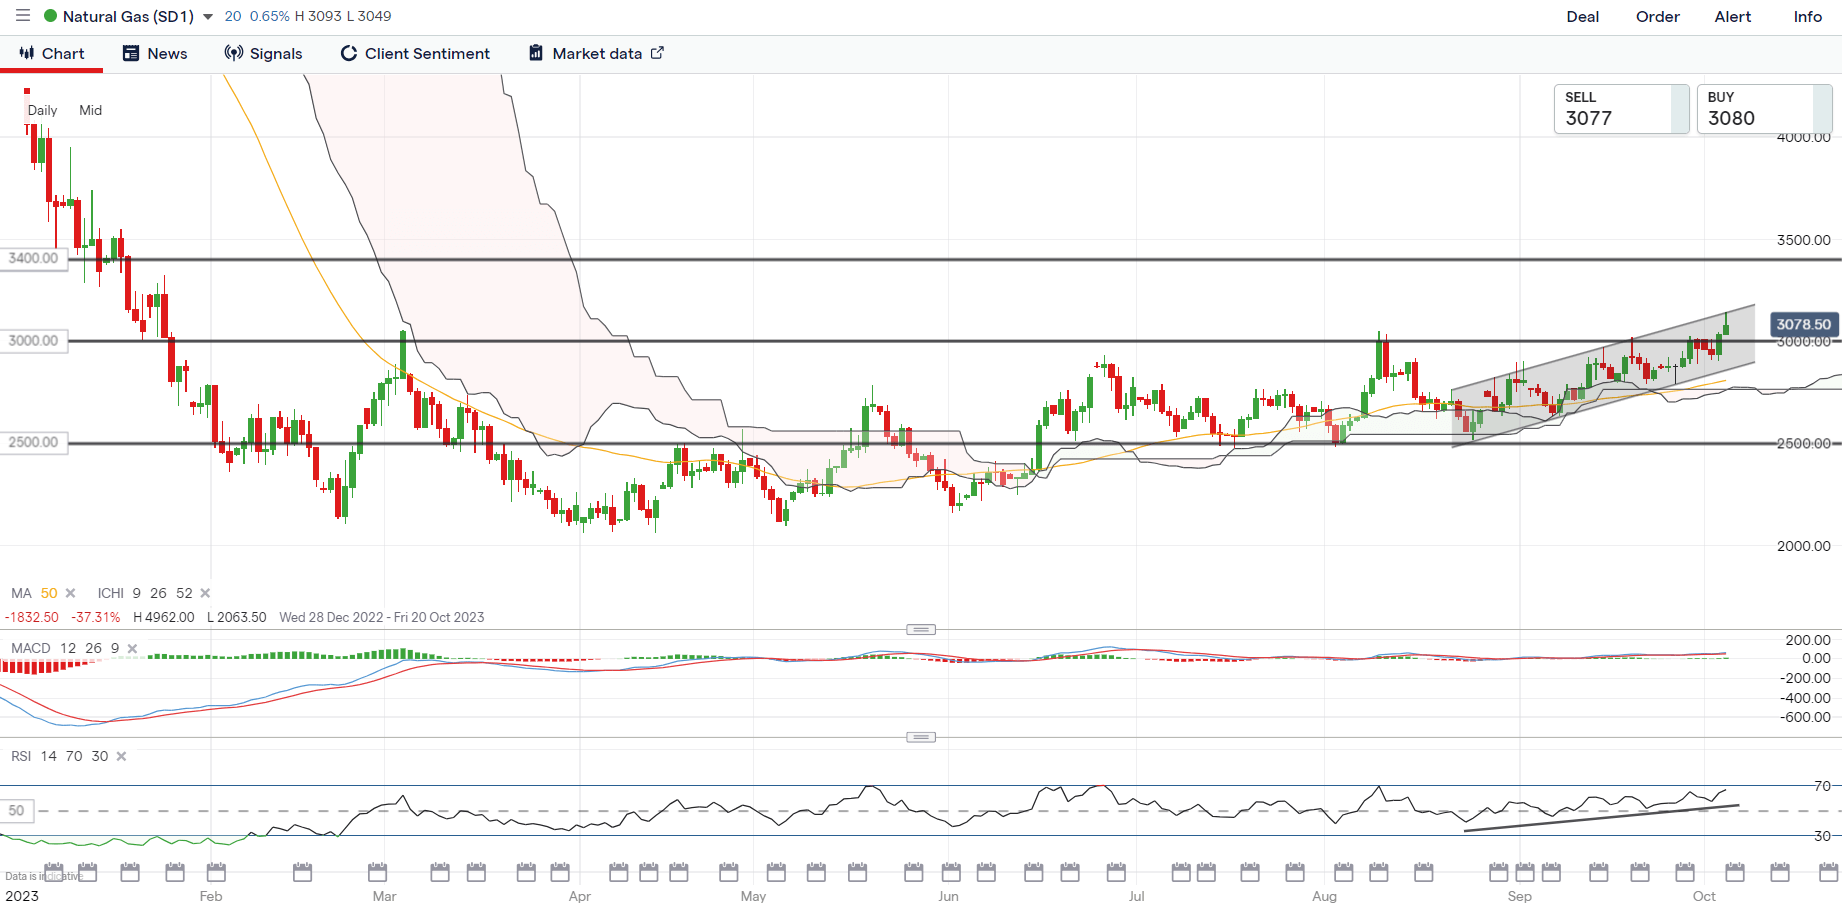
Natural gas prices have been largely stuck in its base-building phase since February this year, but are starting to see some signs of life lately, as a near-term ascending channel pattern led prices to touch a new eight-month high overnight. Thus far, prices have managed to stay above its Ichimoku cloud zone on the daily chart after reclaiming it back in June 2023, with the cloud providing intermittent support on at least three previous occasions.
For now, its weekly RSI is also attempting to cross above the key 50 level for the first time since September 2022, with further positive follow-through reflecting buyers taking greater control. On the downside, the $3.000 level will serve as near-term support to hold while further upside may leave sight on the $3.400 level next.

Source: IG charts
Wednesday: DJIA +0.39%; S&P 500 +0.81%; Nasdaq +1.35%, DAX +0.10%, FTSE -0.77%


