


Australian Dollar Forecast: Bullish
- The Australian Dollar bounced off some trend lines last week
- The RBA has locked arms with other central banks as uncertainty brews
- If central bankers don’t know where rates are going, how can we?

The Australian Dollar is fighting to fend off a capitulation to lower levels as the US Dollar considers its own fate with risks across the globe swirling in the face of pandemic-induced stimulus withdrawal symptoms.
Soft economic data in the world’s largest economy last week saw equity markets take on the ‘bad news is good news’ slogan.
The perception that a weakening economy can be seen as a positive is all the rage in denialist stock market bulls.
This perspective is drawn from the belief that the Federal Reserve will cease with its pesky hawkishness and return to printing money.
In December, it will be 27 years since former Fed Chair Alan Greenspan’s infamous ‘irrational exuberance’ speech.
Sadly, he turned his back on his own words not long after and the era of the Fed rescuing equity markets began.
However, the current Fed board members appear to have a bit more gumption than their recent predecessors if their words are to be believed.
The test of their mettle might be approaching in the inflation fight. As one pundit said this week, ‘central bankers are not meant to be popular’.

I digress, the Aussie Dollar is caught up in this fractious environment and the uncertainty around monetary policy is back to normal programming in many senses.
This time last year, every Western central bank, and many others, were messaging very clearly that rates were going north.
Now, it is data-dependent. It is a meeting-by-meeting scenario and the incoming Governor of the Reserve Bank of Australia (RBA), Michele Bullock, made this clear during the week.
Overall, the domestic economic picture deteriorated slightly in the last few days with building approvals collapsing yet again.
The meaningless monthly CPI number was soft, but who cares other than mainstream media folk whose favourite pastime is to stoke the mortgage belt.
Looking forward, the RBA appears to be a dead certainty to keep rates on hold this Tuesday as this has been clearly telegraphed.
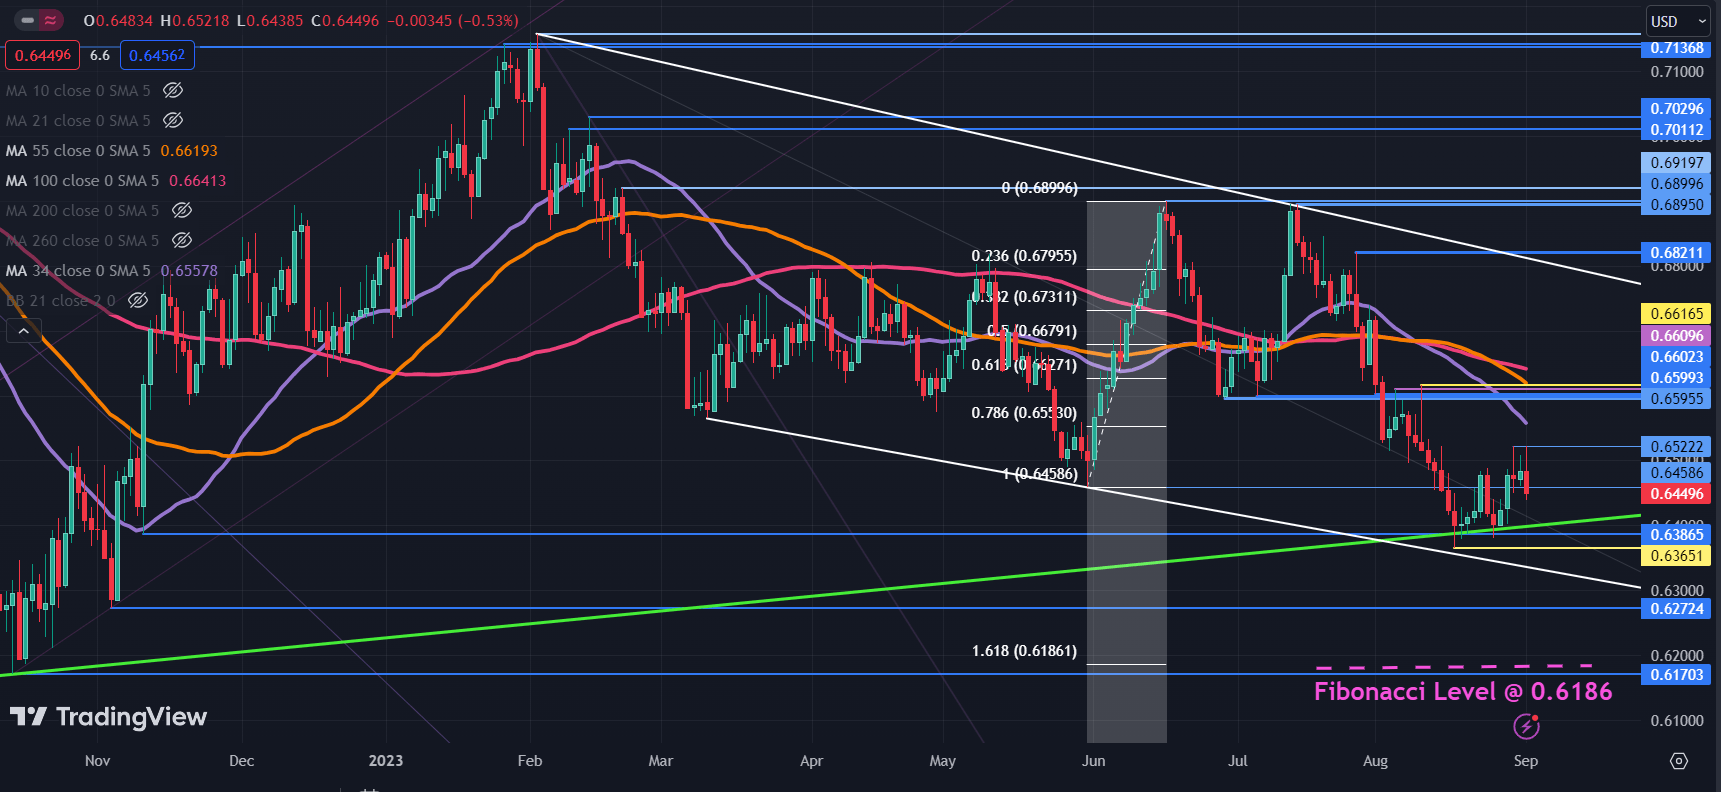
AUD/USD DAILY CHART
AUD/USD appears to be at somewhat of a crossroads. It has consolidated after bouncing off a long-term ascending trend line but remains in a shorter-term descending trend channel.
The price remains below the 34-, 55- and 100-day Simple Moving Averages (SMA) which may suggest that bearish momentum is intact for now.
The 0.6600 - 0.6620 area seems to be shaping up as a notable resistance zone with several breakpoints and prior peaks there.
The 100-day SMA is currently just above there, near 0.6640 and if it clears that, it might indicate that the overall range trade scenario is intact for now.
To learn more about range trading, click on the banner below.
On the downside, support may lie at the breakpoints and previous lows of 0.6386,
0.6365, 0.6272 and 0.6170.
The latter might also be supported at 161.8% Fibonacci Extension level at 0.6186.

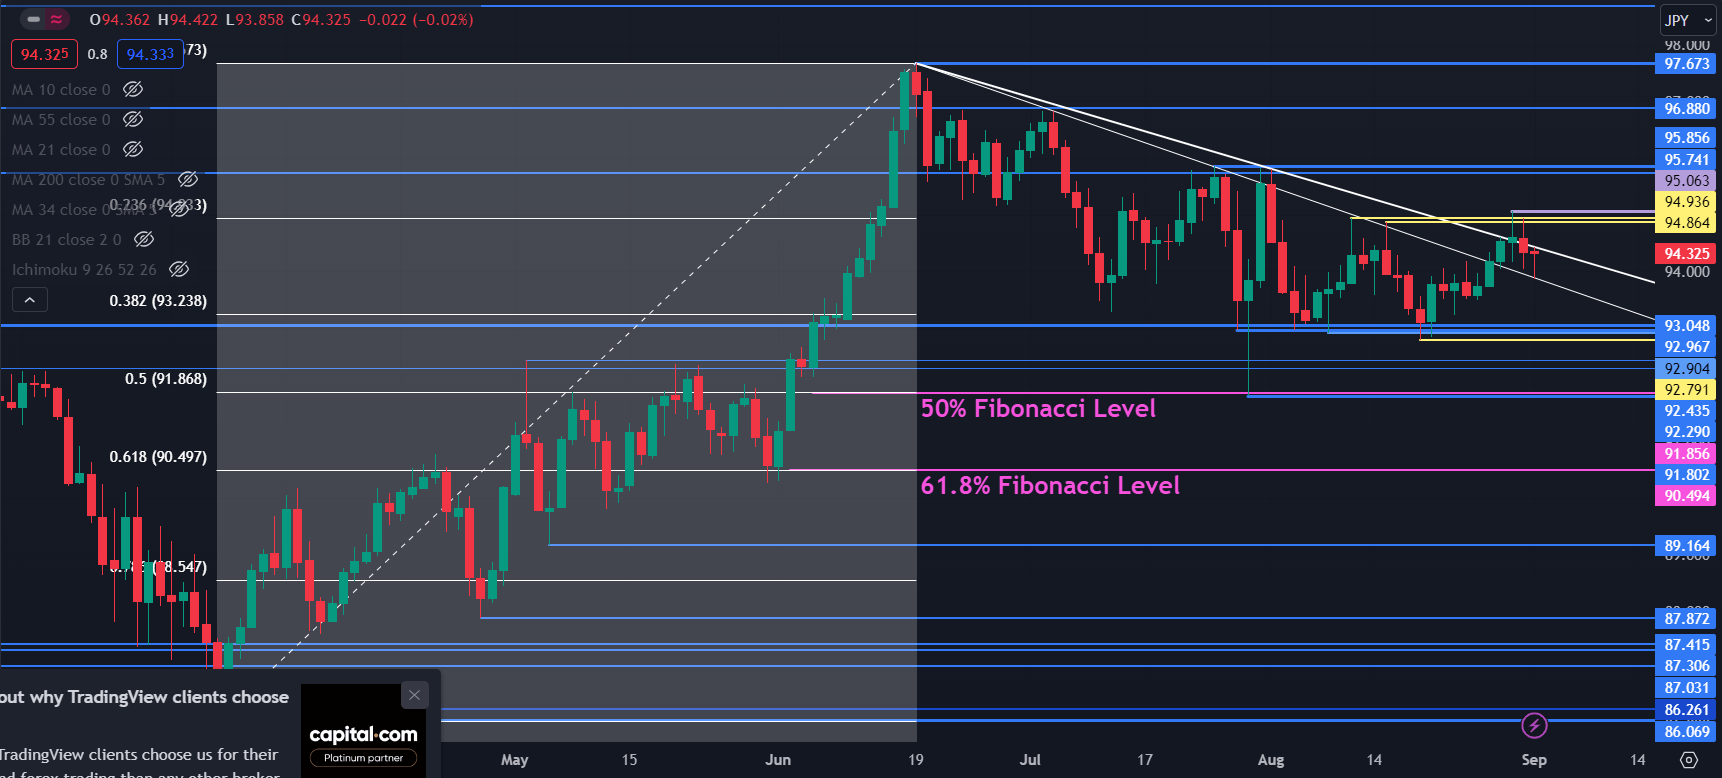
AUD/JPY TECHNICAL ANALYSIS UPDATE
AUD/JPY consolidated last week after failing to make the most of a topside break.
On the downside, there are a series of prior lows and breakpoints in the 92.80 – 93.00 area that may provide a support zone.
Further down, support may lie at breakpoints of 92.30 and 92.44 ahead of the 50% Fibonacci Retracement level at 91.85 which is near the July low of 91.80.
Support might also be at 61.8% Fibonacci Retracement level at 90.50. To learn more about Fibonacci techniques, click on the banner below.
On the topside, resistance could be at the descending trend lines currently dissecting near 94.20 and 94.60. The previous peaks near 94.90 may also offer resistance.
Resistance could also be found at the prior peaks and breakpoints of 95.74, 95.85, 96.88 and 97.67.
Trade Smarter - Sign up for the DailyFX Newsletter
Receive timely and compelling market commentary from the DailyFX team
--- Written by Daniel McCarthy, Strategist for DailyFX.com
Please contact Daniel via @DanMcCarthyFX on Twitter


