


Australian Dollar Forecast: Bullish
- The Australian Dollar bears have had a good run with US Dollar strength
- Treasury yields have supported USD, undermining some commodity markets
- Overall ranges are intact for AUD/USD and AUD/JPY. Will they break?
Trade Smarter - Sign up for the DailyFX Newsletter
Receive timely and compelling market commentary from the DailyFX team
The Australian Dollar languished around recent lows last week with US dollar dominance coming back into vogue, impacting risk assets and commodities.
The ‘big dollar’ appears to have been supported by Treasury yields resuming their march higher with the benchmark 2-year note eclipsing 4.91% on Friday, after visiting 4.72% during the week.
US CPI printed slightly below estimates last Thursday with headline CPI rising by 3.2% year-on-year to the end of July, rather than the 3.3% forecast but still well above the 2% target.
Interest rate markets initially saw this softening of price pressures as a move toward lower rates sooner than previously thought.
That notion was hosed down by several Fed speakers going into the weekend that reiterated the mantra that monetary policy will need to remain tight for some time in order to rein in inflation.
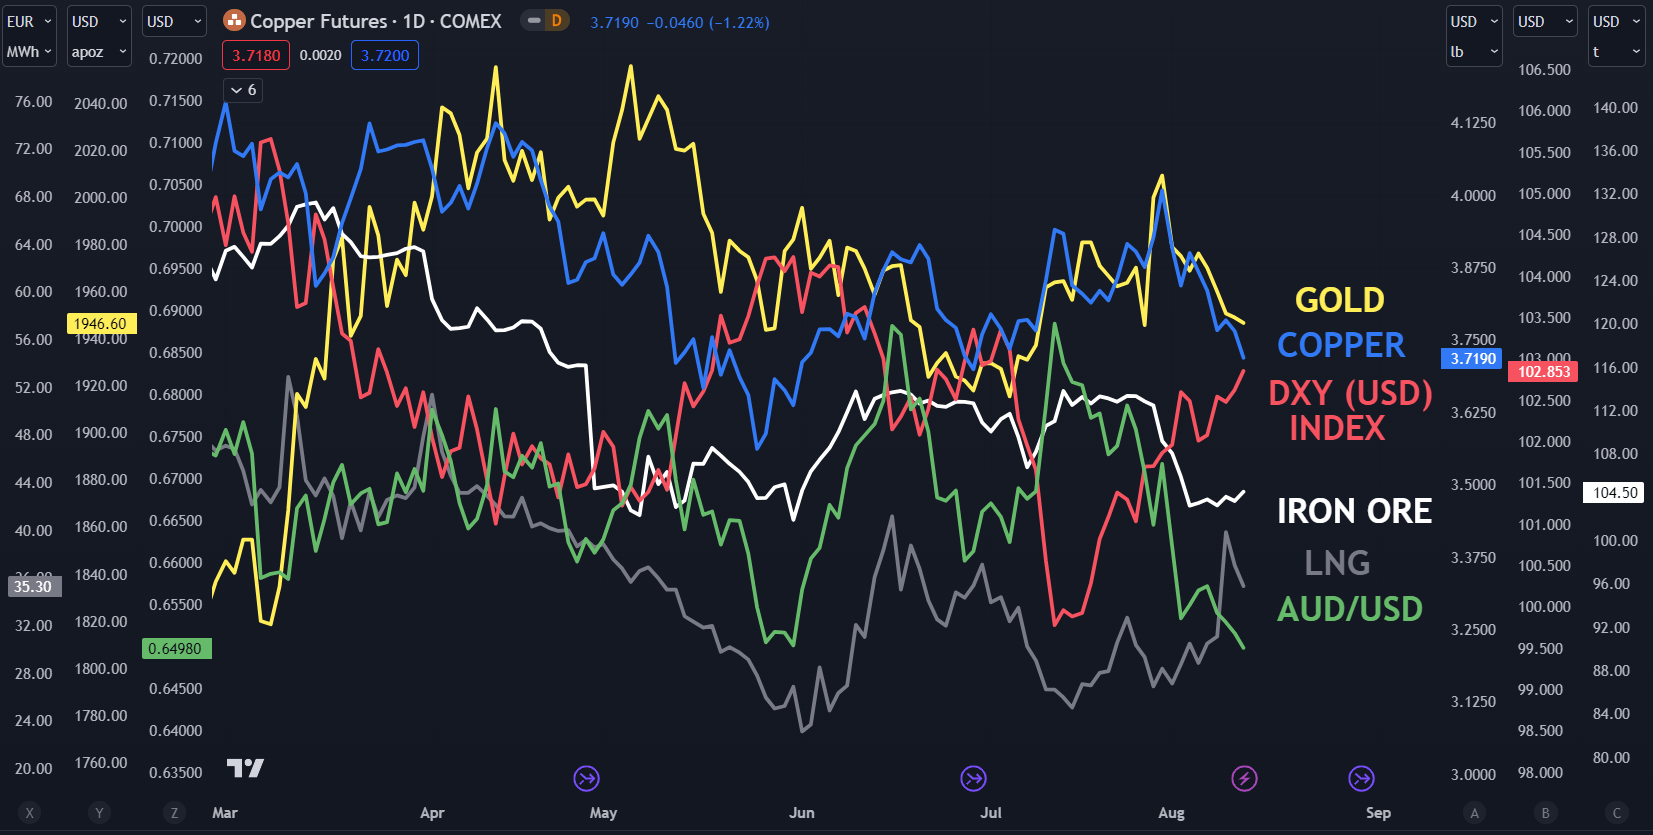
The stronger US Dollar saw the commodity complex slide lower with gold and copper the notable underperformers. Crude oil was an exception to this trend, with the energy market continuing to be bolstered.
The sector has been assisted by liquefied natural gas prices (LNG) surging on the prospect of strike action in Australia at Woodside Energy Group and Chevron. The operations in the northwest of the continent account for around 10% of the global export markets.
LNG is Australia’s second largest-export and while higher prices may initially look good, it might come at the cost of lower volume on ships in the quarters ahead.

Outgoing RBA Governor Philip Lowe spoke at the House of Representatives Standing Committee on Economics on Friday. There were few surprises in his statement and follow-up questions.
On inflation, he noted again that energy and the cost of building a home were the main factors bringing inflation down while rents and services are continuing to add to price pressures.
The market is not anticipating any more rate hikes from the RBA this year.
Elsewhere, the Japanese Yen has been deteriorating across the board in the aftermath of the Bank of Japan tinkering with its yield curve control program at its latest meeting.
It reached a 15-year low against the Euro last week, but AUD/JPY has not benefitted in the same way and the cross-rate appears range bound for now.
Looking ahead, Australian jobs data will be released on Thursday. It appears for now though that the dynamics around Treasury yields may drive US Dollar volatility. This could feed into commodity markets and Aussie Dollar movements.
CHART - AUD/USD, COPPER, GOLD DXY (USD) INDEX, IRON ORE.

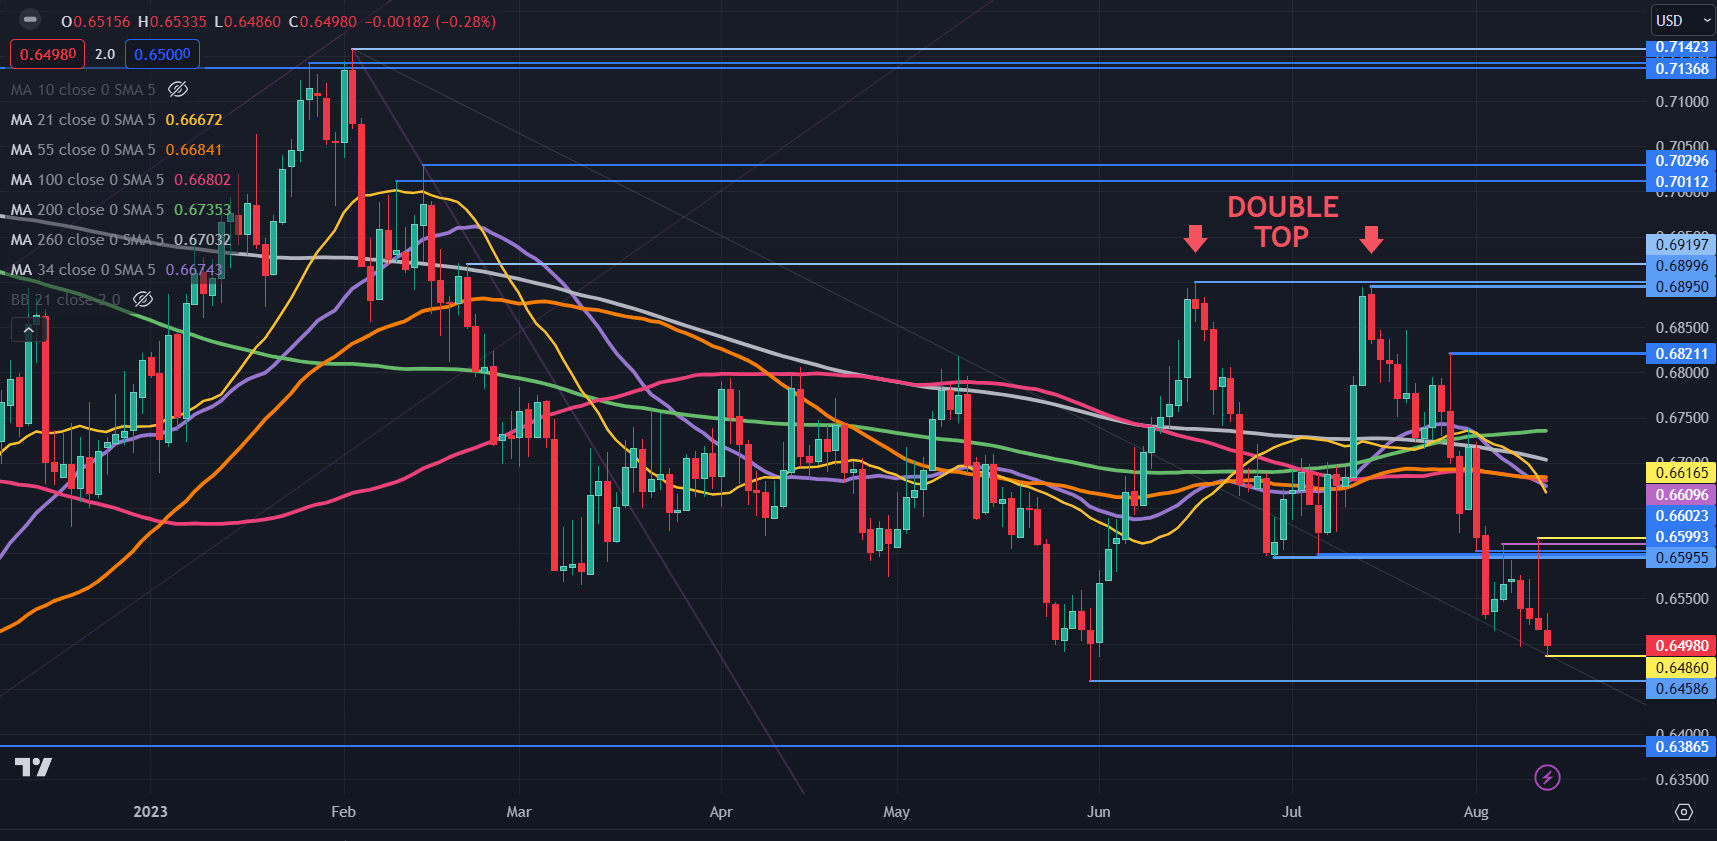
AUD/USD TECHNICAL ANALYSIS
Overall, AUD/USD remains in the six-month trading range of 0.6459 – 0.6900.
Nearby resistance could be at a cluster of breakpoints and prior peaks in the 0.6595 – 0.6615 area ahead of the simple moving averages (SMA).
On the downside, support might be near the recent lows of 0.6486 and 0.6459.
The price remains below 21-, 34-, 55-, 100-, 200- and 260-day SMAs.
Technical analysts would typically note this as potentially bearish. However, they all lie between 0.6667 and 0.6735, a historically narrow range of around 70 tics.
The range trading price action seems to have increased the mean reversion characteristics of the SMAs. If the range holds, the Aussie might cross the SMAs yet again.
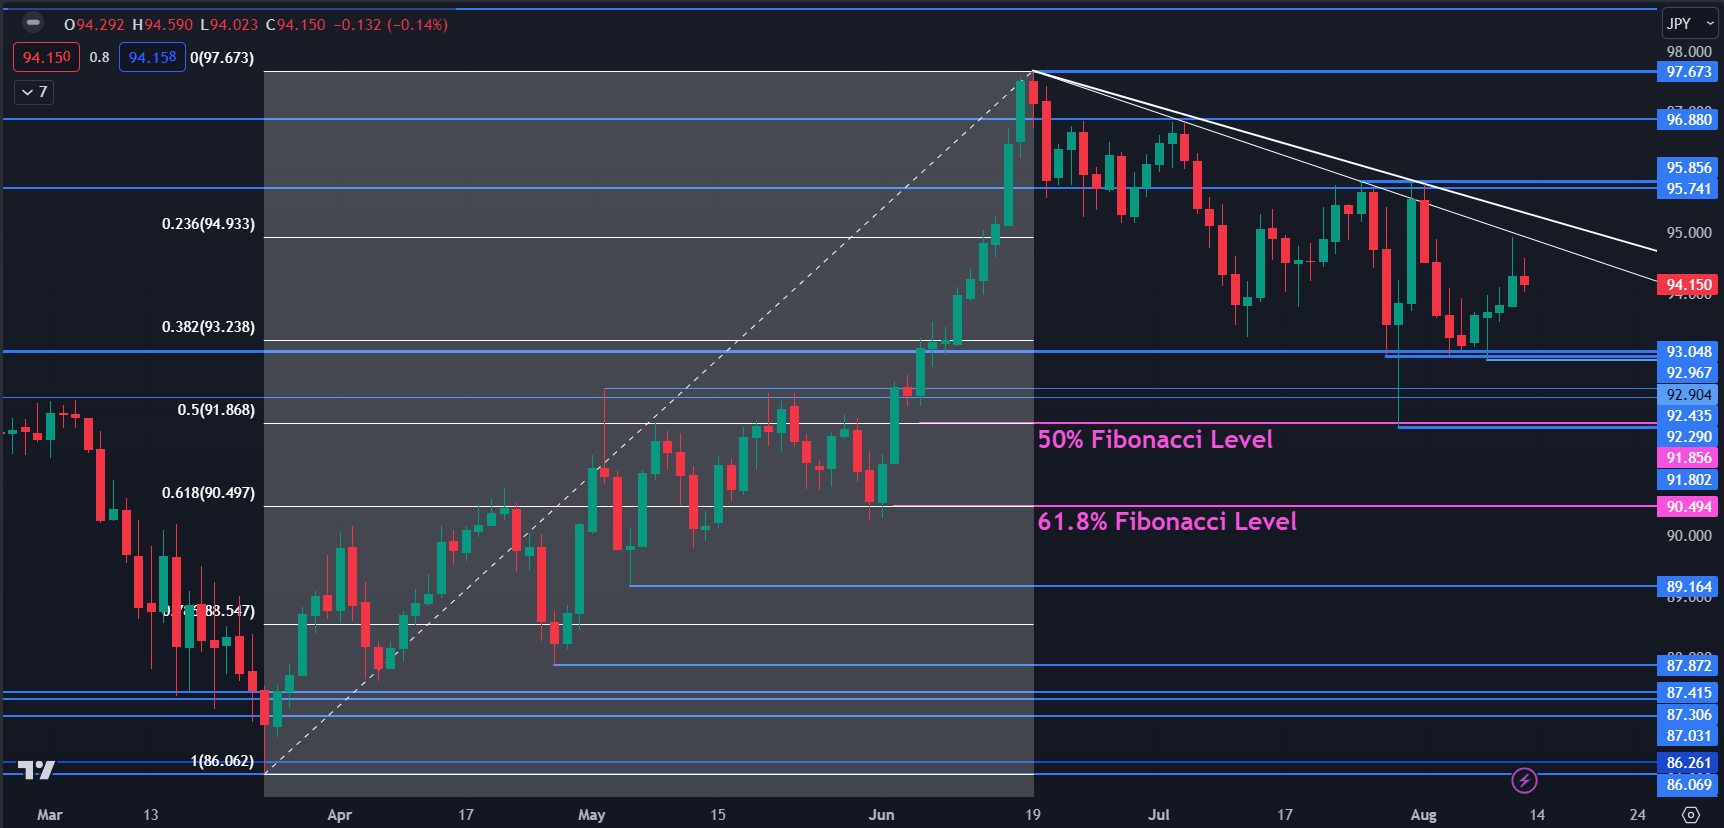
AUD/JPY TECHNICAL ANALYSIS
Since making a high at 97.67 in June, AUD/JPY has had three notable rallies. An attempt to break above the initial descending trend line failed but another trend is in place and they may offer resistance near 94.90 and 95.20.
Resistance could also be found at the prior peaks and breakpoints of 95.74, 95.85, 96.88 and 97.67.
On the downside, support could be found in the 93.00 – 93.20 area where a series of breakpoints and previous lows are located.
Further down, support may lie at breakpoints of 92.30 and 92.44 ahead of the 50% Fibonacci Retracement level at 91.85 which is near the July low of 91.80.
Support might also be at 61.8% Fibonacci Retracement level at 90.50. To learn more about Fibonacci techniques, click on the banner below.

--- Written by Daniel McCarthy, Strategist for DailyFX.com
Please contact Daniel via @DanMcCarthyFX on Twitter


