

Bitcoin (BTC) Prices, Charts, and Analysis:
- Bitcoin looking at $37.3k as the next level of resistance.
- Spot ETFs would change the landscape for Bitcoin.

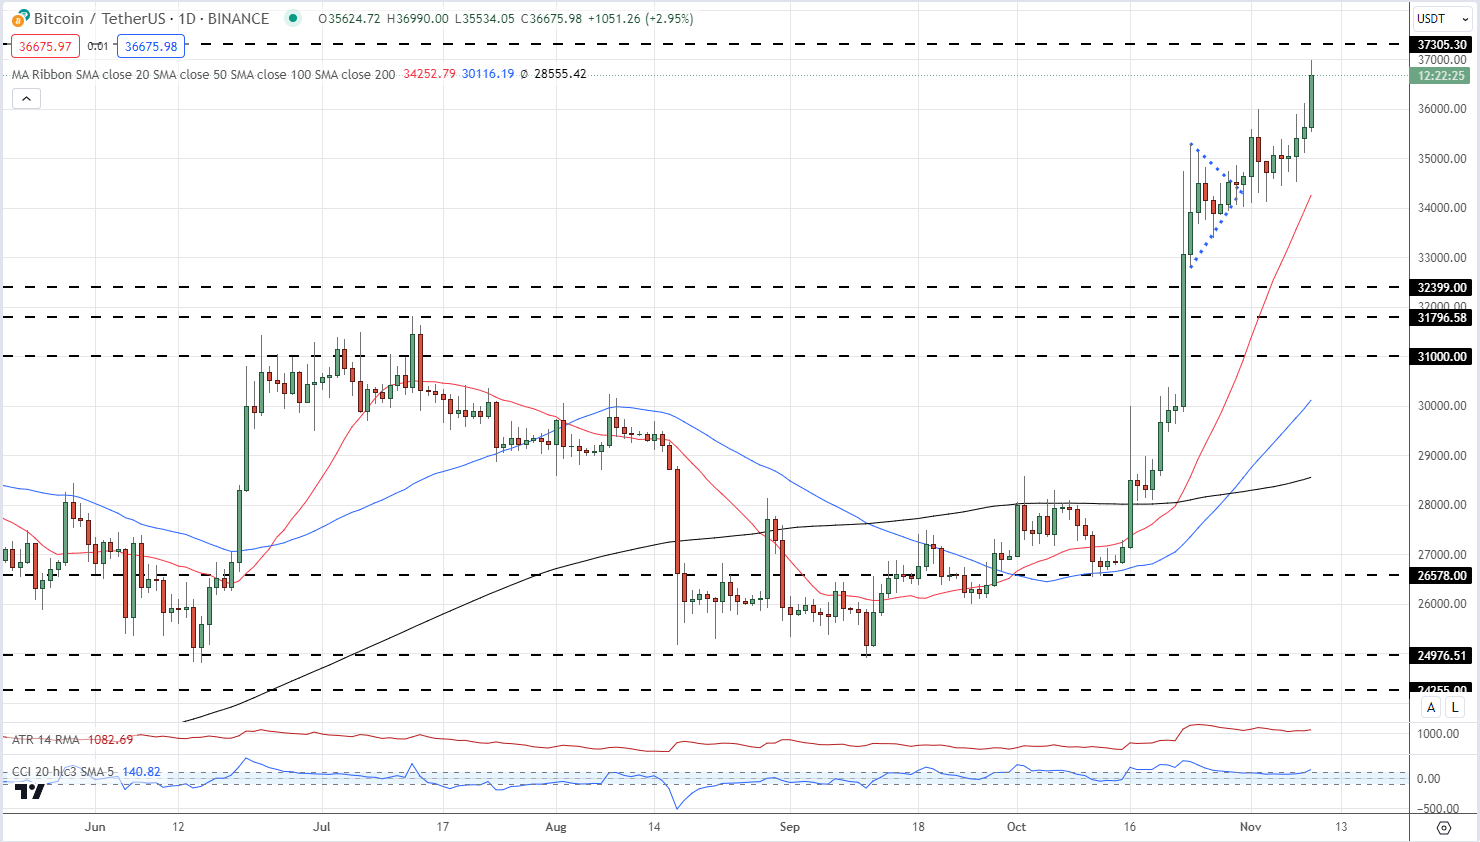
At the end of October, we identified a Bullish Pennant pattern forming on the daily Bitcoin chart, along with a Golden Cross, another positive technical set-up. Since then Bitcoin has rallied by around $3,000 and is currently eyeing the next level of resistance at $37.3k. This level looks vulnerable and a concerted push would open the way to the next level of interest at $40k.
Bitcoin (BTC) Technical Outlook – Charts Suggests Higher Prices are Likely
Bitcoin guide
Bitcoin (BTC/USD) Daily Price Chart – November 9, 2023

The driving force behind the latest move higher is the growing belief that the SEC will shortly grant a raft of spot Bitcoin ETF applications. According to Bloomberg research, there is a window between November 9 and November 17 when all twelve ETF applications could be approved. The Bloomberg analysts assign a 90% chance that a Bitcoin ETF will be approved before January 10, 2024.
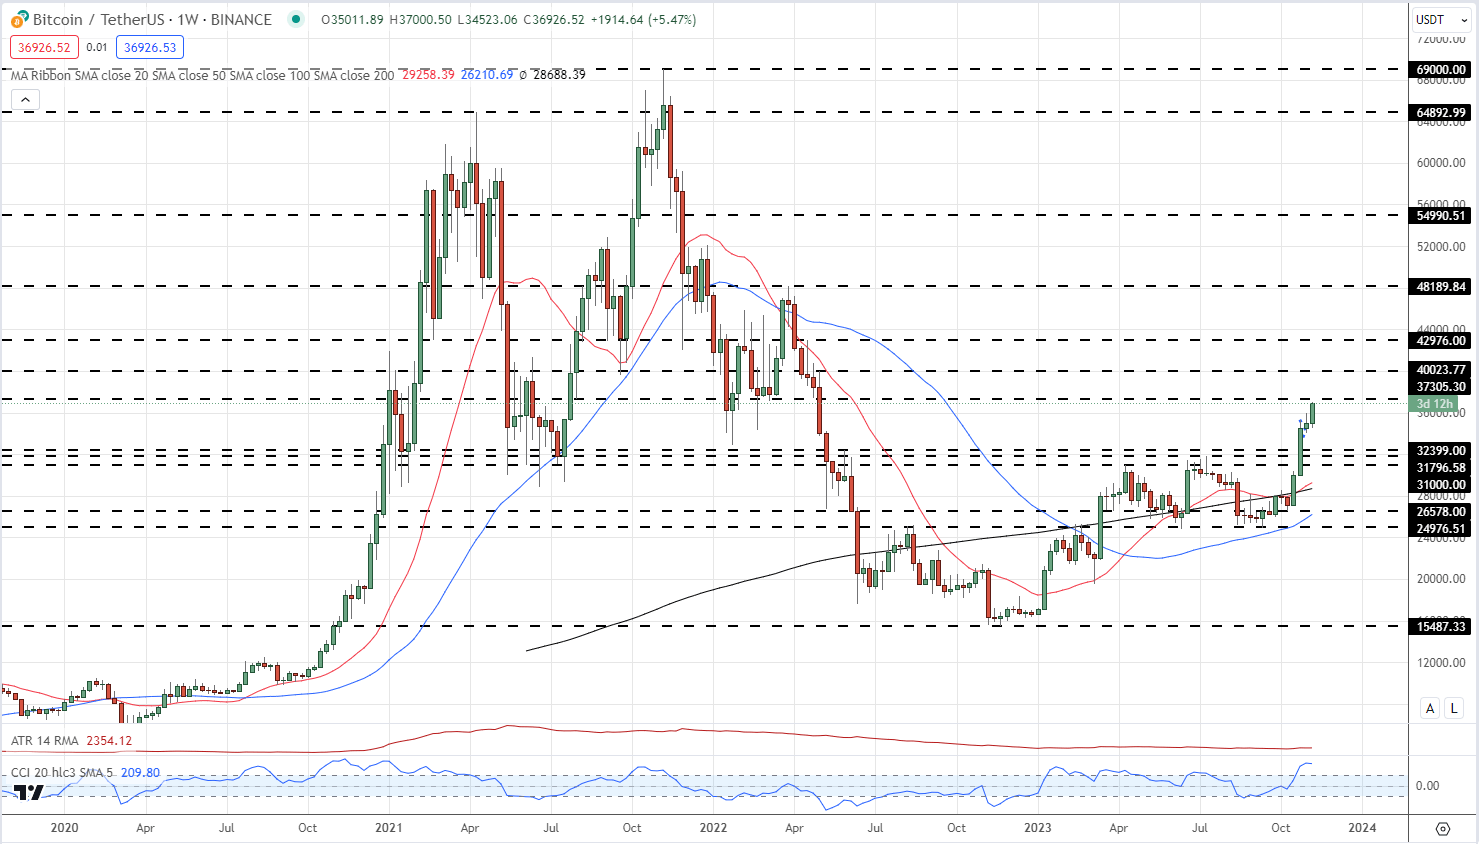
Looking further ahead, the $40k level may not hold Bitcoin for long. The largest cryptocurrency by market capitalization may well accelerate higher if/when spot ETFs are approved, especially as BTC nears its latest ‘halving’ event due in late April. After the halving, the block reward for miners will be reduced by 50% to 3.125 BTC from 6.25. The weekly chart shows resistance at $40k and a fraction under $43k before a gap to $48.2k appears.
If spot ETFs are not approved, Bitcoin could quickly fall to $32.4k before $31.8k and $31.0k come into focus.
Bitcoin (BTC/USD) Weekly Price Chart – November 9, 2023
Charts via TradingView
What is your view on Bitcoin – bullish or bearish?? You can let us know via the form at the end of this piece or you can contact the author via Twitter @nickcawley1.