

Bitcoin (BTC/USD) Talking Points
- Bitcoin prices remain rangebound - 2017 high holds as critical resistance
- BTC/USD threatens trendline resistance, but bears fight back
- USD weakness boost stocks while cryptocurrency lag

Bitcoin Technical Analysis
Bitcoin prices have continued to consolidate within a narrow range, formed by key technical levels of prior moves. With earnings season currently underway, resilient earnings from Goldman Sachs and a weaker US Dollar allowed major stock indices to hold gains, driving equity futures higher.
Although there has been a positive correlation (they generally move in the same direction) between stocks and cryptocurrency throughout the year, BTC/USD has remained constrained by technical resistance which continues to hold firm.
Visit DailyFX Education to Learn How to Trade Ranges
With a broader range forming between 17,792 (the 78.6% Fib of the 2020 – 2021 move) and 20,500, the 19,666 has proven to be another big level for both the short and long-term move.
For those who may recall, this level was the prior all-time high that capped the upside move in December 2017 and again in December 2020. Now, almost two-years later and this level continues to hold bulls at bay.

Bitcoin (BTC/USD) Weekly Chart
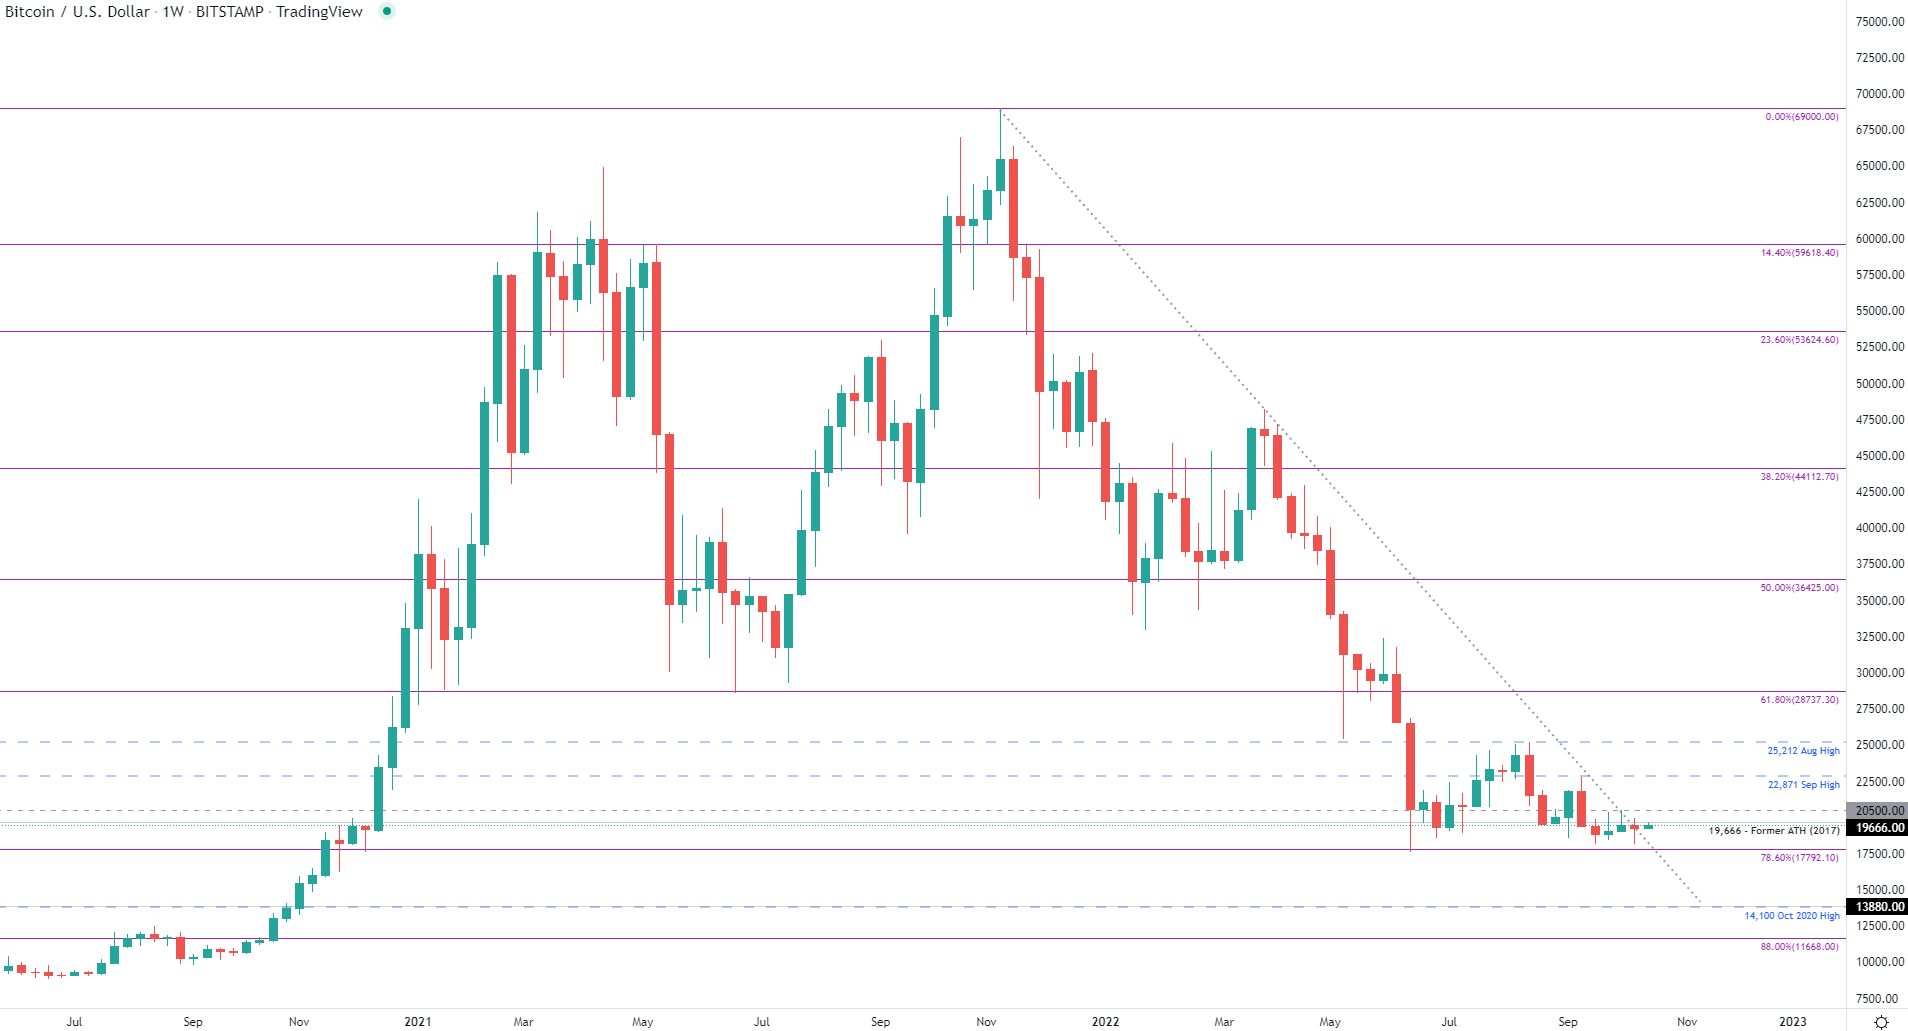
Chart prepared by Tammy Da Costa using TradingView
As bulls struggle to clear trendline resistance (from the 2021 high), the daily chart below further highlights the short-bodied candles that have been forming over recent weeks. With a tighter range forming between 18,183 and 19,666, a break of either side could fuel momentum, opening the door for a breakout.
Bitcoin (BTC/USD) Daily Chart
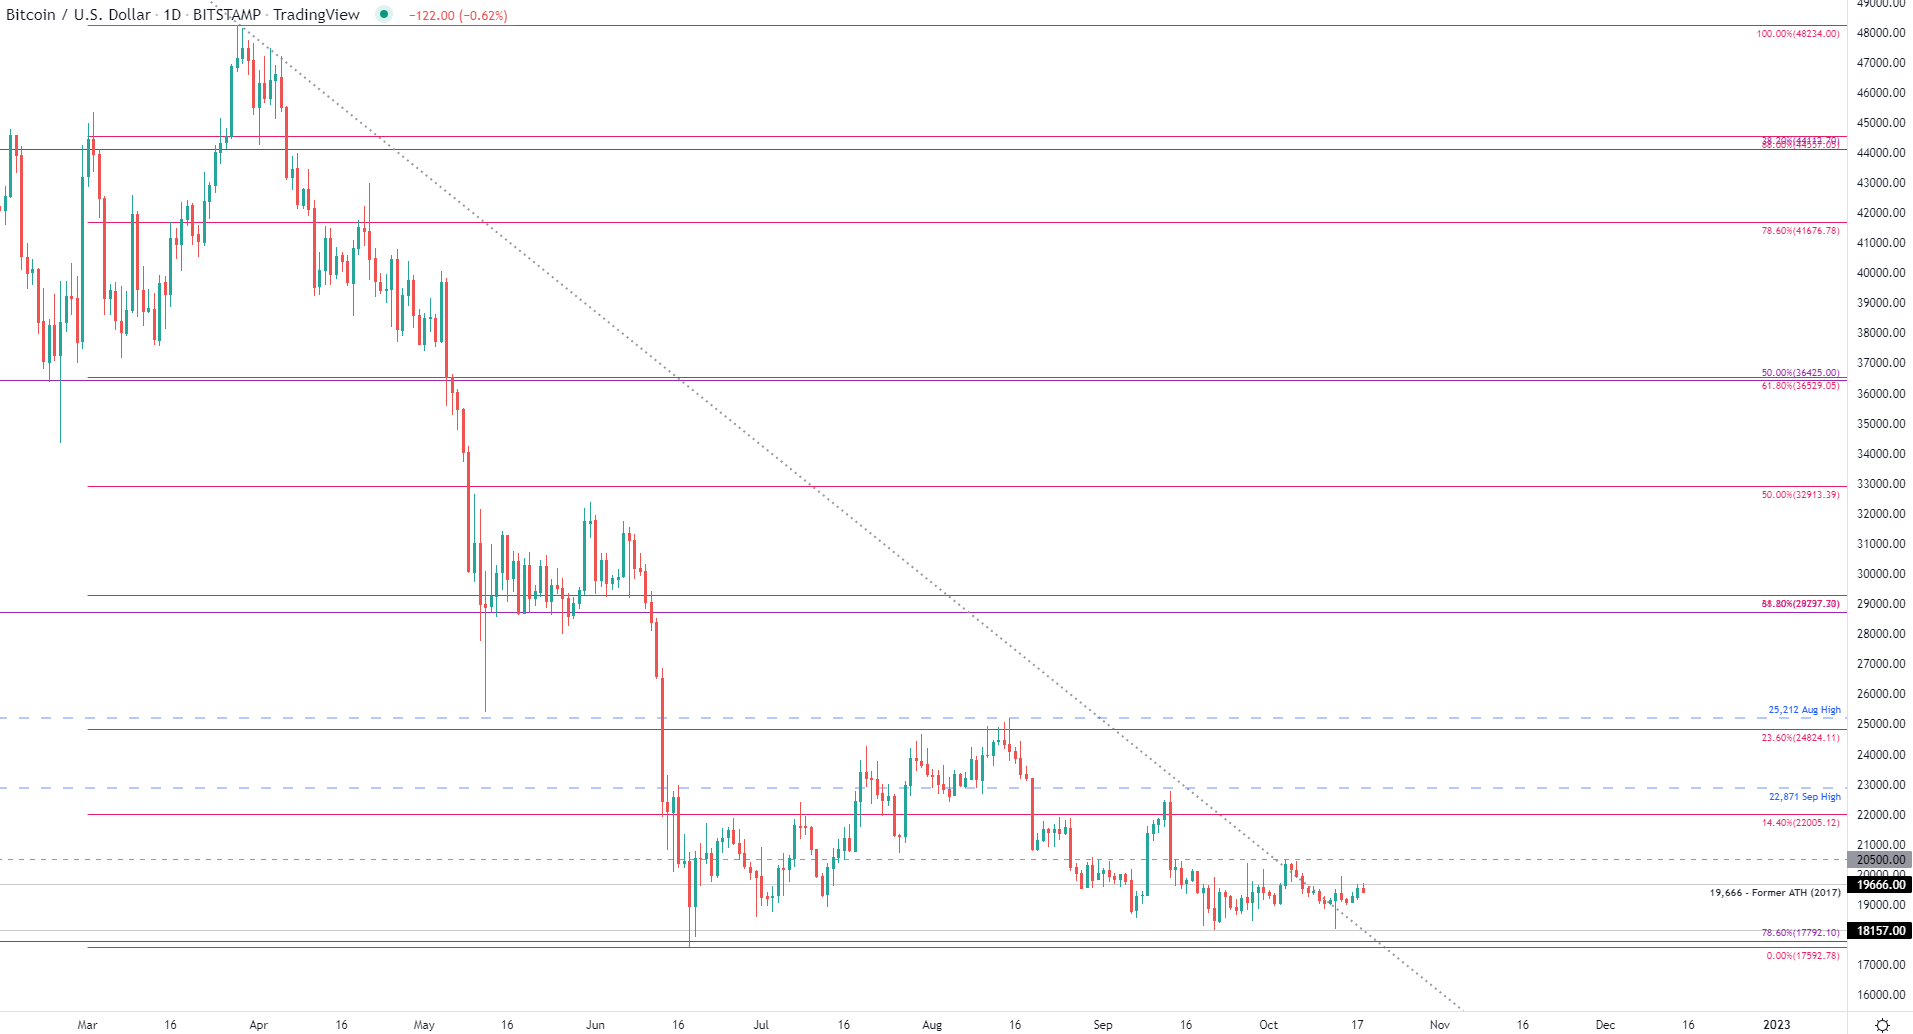
Chart prepared by Tammy Da Costa using TradingView
However, with the above-mentioned range currently intact, the below levels may provide an additional catalyst for price action.
Bitcoin (BTC/USD) Key Levels
| Support | Resistance |
|---|---|
| 18,183 (October low) | 19,666 (2017 High) |
| 17,792 (78.6% retracement 2020 – 2021 move) | 20,500 (Psychological Resistance) |
| 16,000 (Psych level) | 22,871 (September High) |
Bitcoin Further Reading:
- What is Bitcoin? Understanding Bitcoin as a Cryptocurrency
- New to Bitcoin? Read how to start trading cryptocurrency guide
- Learn how to day trade Bitcoin & other major crypto
--- Written by Tammy Da Costa, Analyst for DailyFX.com
Contact and follow Tammy on Twitter: @Tams707