
GBP/USD Analysis and Charts
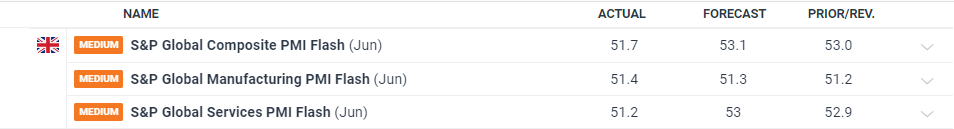
- UK PMIs miss forecasts.
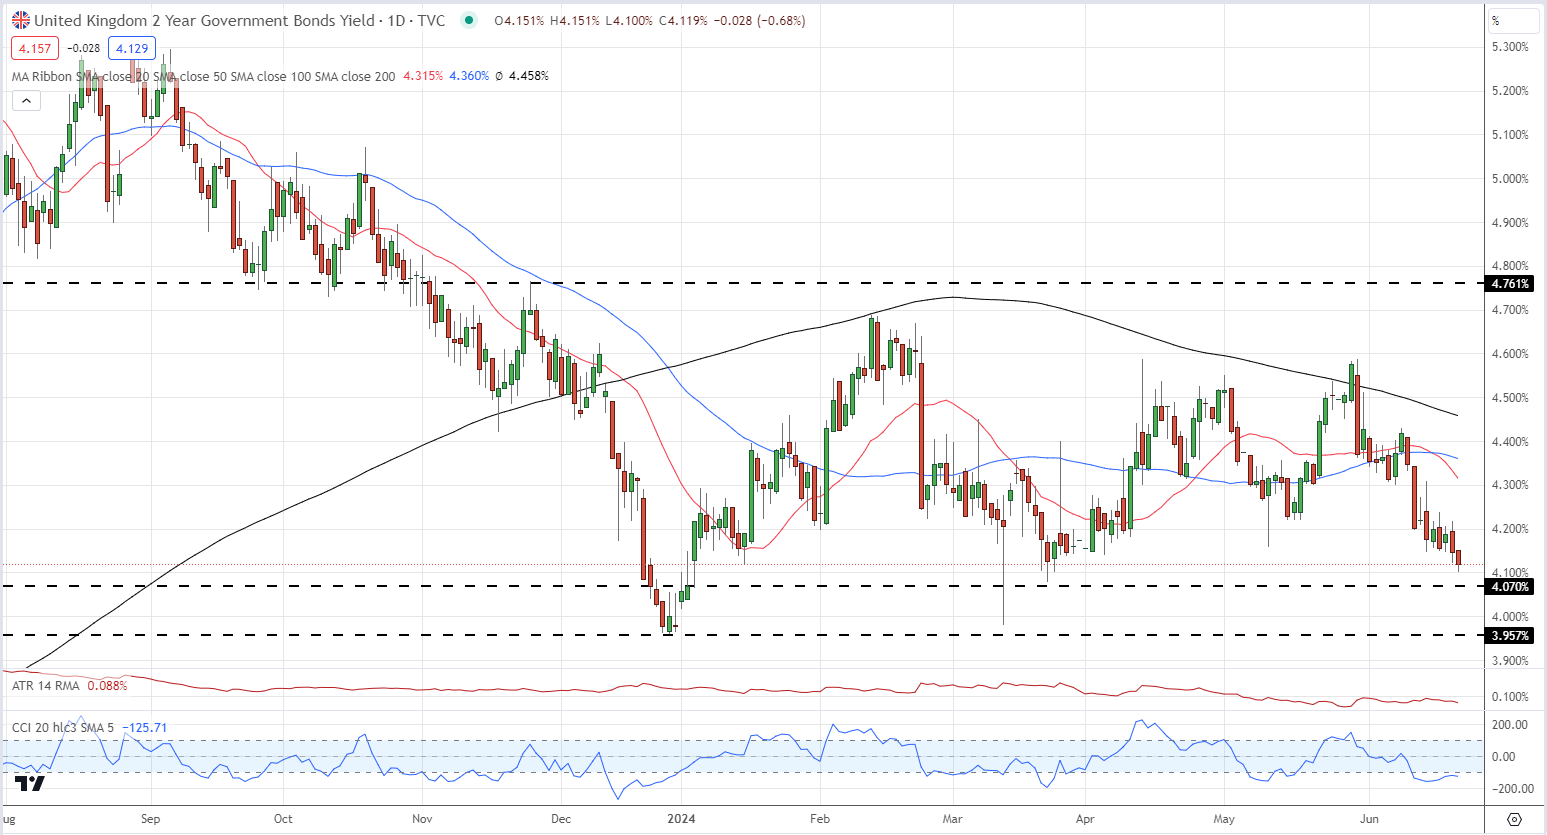
- UK government bond yields post multi-week lows.
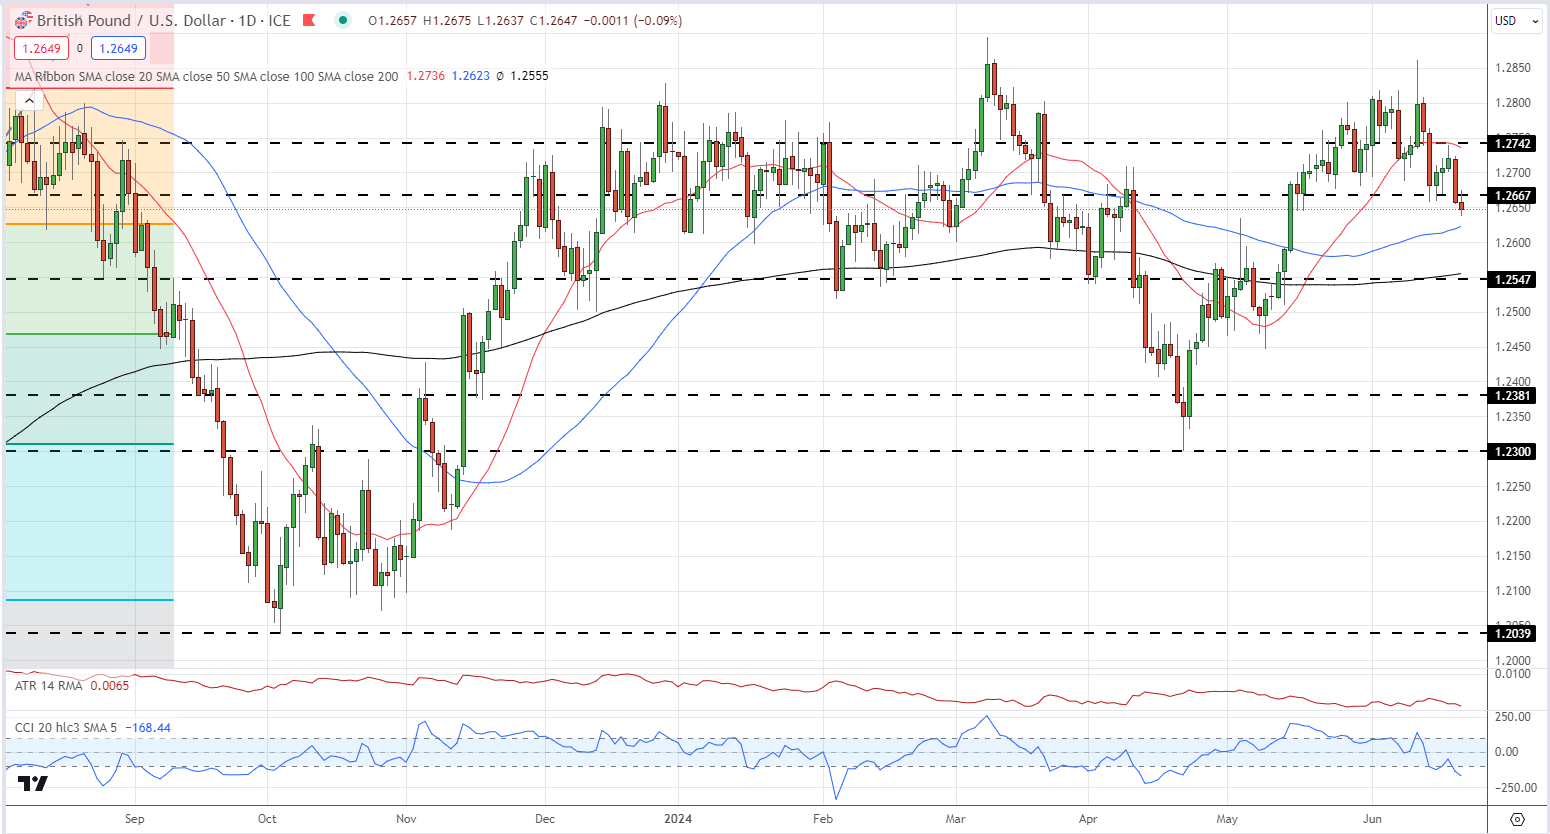
- Cable below 1.2650, CCI indicator suggests GBP/USD is oversold.

UK private sector business activity expanded in June at its slowest rate since last November, according to the latest S&P Global Flash UK PMI report. According to Chris Williamson, chief business economist at S&P Global, the slowdown in part ‘reflects uncertainty around the business environment in the lead up to the general election.’ Stubbornly high UK services sector inflation ‘remains evident in the survey, but should at least cool further from the current 5.7% pace in coming months.’
For all market-moving economic data and events, see the DailyFX Economic Calendar
UK government bond yields continue to slip lower, fuelled by yesterday’s dovish nudge by the Bank of England. Financial markets are now pricing in a 50/50 chance of a 25 basis point rate cut at the August BoE monetary policy meeting and a total of just under 50 basis points of cuts this year.
Bank of England Leaves Rates Unchanged, Sterling and Gilt Yields Drift Lower
UK 2-Year Gilt Yields
Cable is back below 1.2650 and at a five-week low. Lower government bond yields and ongoing uncertainty ahead of the July 4th UK general election is weighing on the British Pound and this pressure is unlikely to ease soon. The daily GBP/USD chart does show the pair in oversold territory and this may slow down any further sell-off in the coming days.
GBP/USD Daily Price Chart
Charts using TradingView
Retail trader data shows 55.39% of traders are net-long with the ratio of traders long to short at 1.24 to 1.The number of traders net-long is 25.52% higher than yesterday and 42.91% higher than last week, while the number of traders net-short is 11.36% lower than yesterday and 13.18% lower than last week.
We typically take a contrarian view to crowd sentiment, and the fact traders are net-long suggests GBP/USD prices may continue to fall.
Traders are further net-long than yesterday and last week, and the combination of current sentiment and recent changes gives us a stronger GBP/USD-bearish contrarian trading bias.
Download the full report to see how changes in IG Client Sentiment can help your trading decisions:
| Change in | Longs | Shorts | OI |
| Daily | 0% | 2% | 1% |
| Weekly | -4% | -3% | -3% |
What is your view on the British Pound – bullish or bearish?? You can let us know via the form at the end of this piece or you can contact the author via Twitter @nickcawley1.