Article by IG Chief Market Analyst Chris Beauchamp
Dow Jones, Nasdaq 100, Nikkei 225 - Analysis and Charts
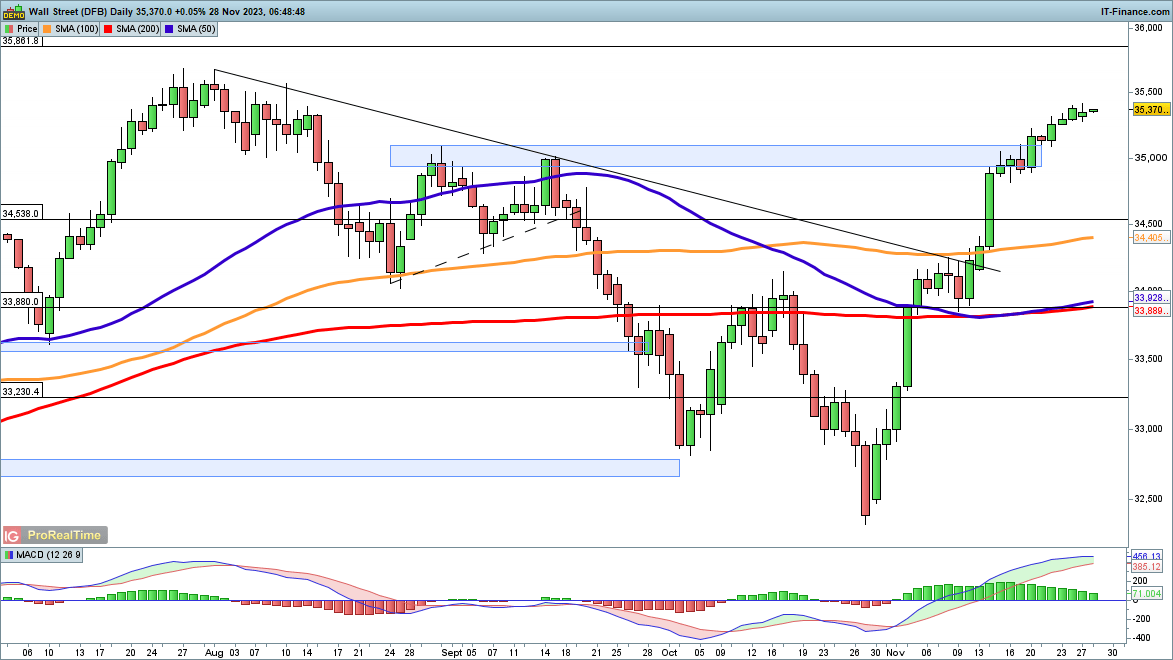
Dow rally sees slower going
The rally has slowed in recent days, though sellers have been unable to establish control even in the short-term timeframes.Further gains continue to target the summer 2023 highs above 35,600, while beyond this the 2022 peaks at 35,860 become the next target.
There is little sign of any retracement as yet, though a close below 35,000 and the August/September highs might put some short-term pressure on the index.
Dow Jones Daily Chart

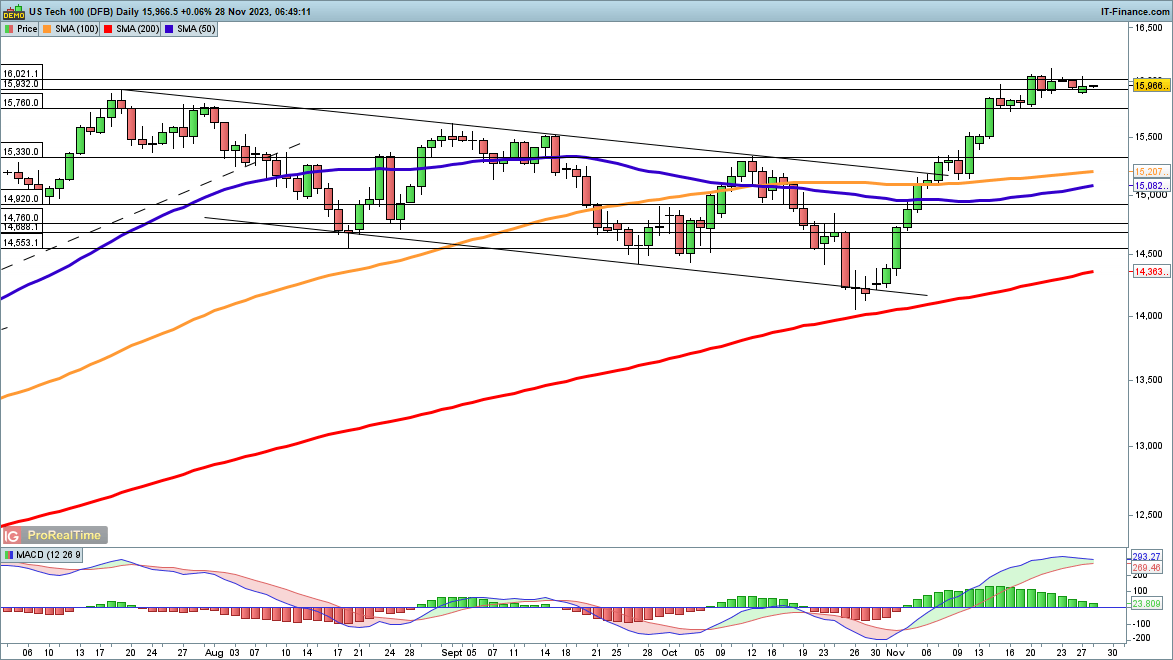
Nasdaq 100 reaches 16,000
For the moment momentum has stalled at 16,000, with the index edging back from last week’s highs.A bigger correction has yet to develop, though a pullback towards 15,500 could easily be envisaged. A close back below the October highs of around 15,330 might signal a more substantial drop in the short term.
Fresh upside above 16,000 would take the index back towards the record highs of late 2021 and early 2022 at 16,630, and complete a remarkable recovery for the tech index.
Nasdaq 100 Daily Chart

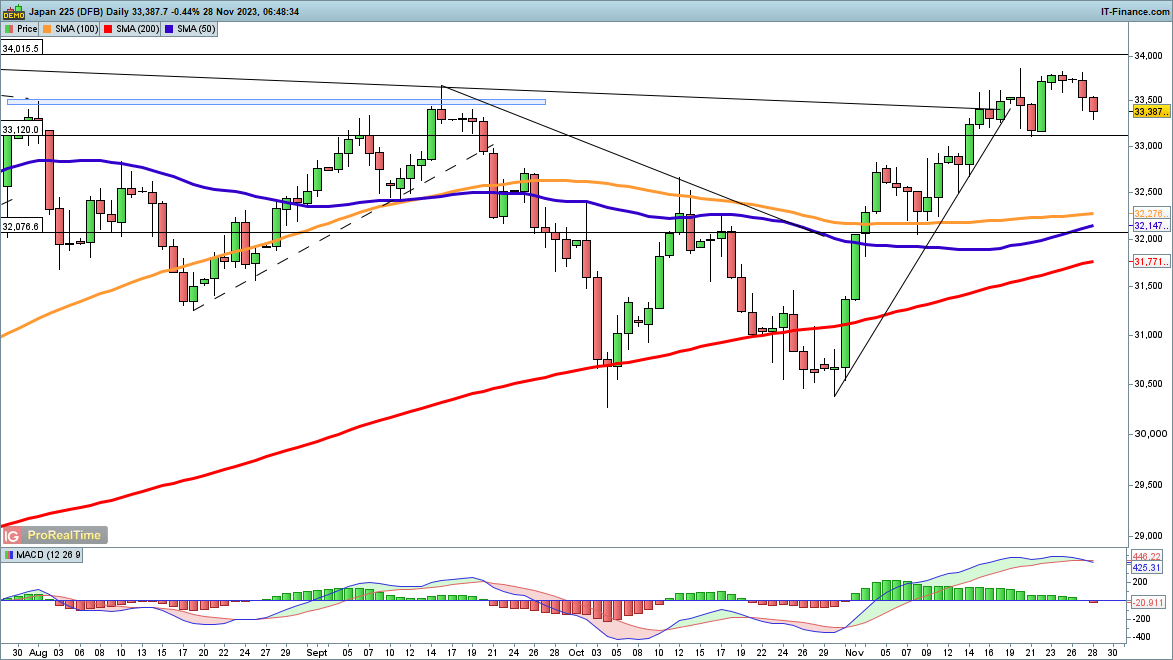
Nikkei 225 slips back towards August highs
Here too the forward momentum of recent weeks has dissipated for the time being, and a move back below the August and September highs around 35,200 seems likely.Last week the index found support at 33,120, so a drop back below this might signal some additional short-term weakness is likely.
A renewed move higher targets the June highs at 34,015, with a close above this level taking the price on towards the 1989 highs at 39,000.
Nikkei 225 Daily Chart