Article written by Christopher Beauchamp, IG Chief Market Analyst
Talking Points:
- Dow consolidation continues
- Nasdaq 100 on the back foot
- Hang Seng hits 14-month low
- Download our brand new Q1 equities forecast below:

Dow Consolidation Goes on
The index continues to consolidate, with no sign yet of a fresh break to the upside.
Futures were muted in Monday’s limited trading, but there is also little indication that a more substantial pullback is at hand. If one does develop it may target the rising 50-day simple moving average (SMA).
It would take only a small bounce for the index to push to a new all-time high.
Wall Street (Dow Jones) Daily Chart
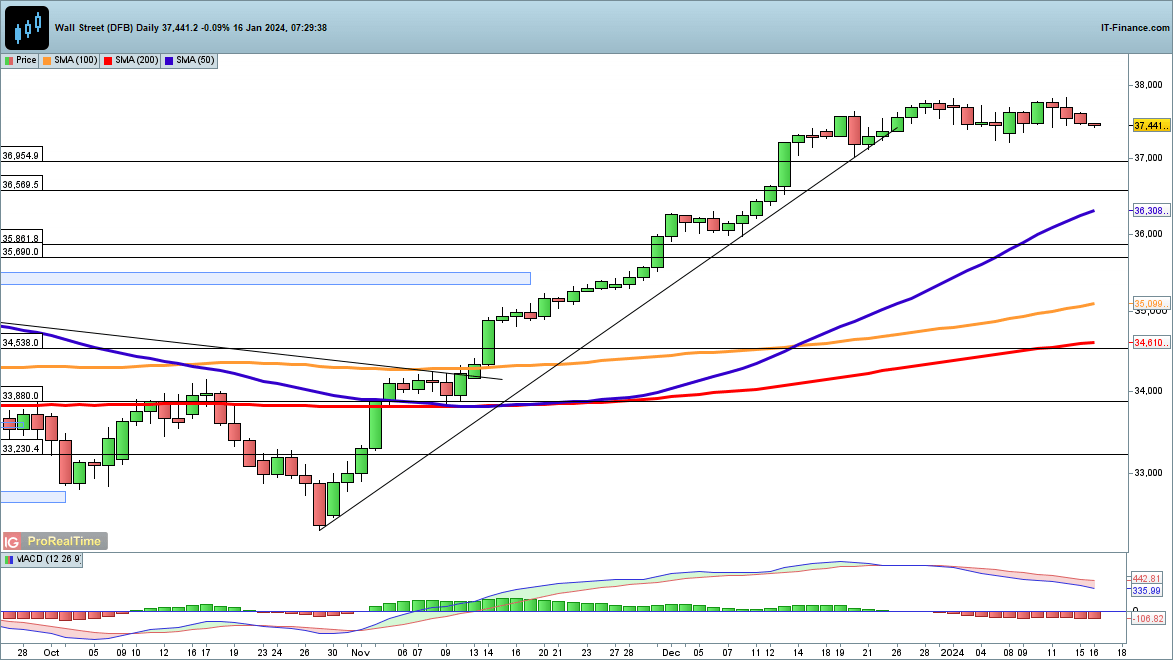
Source: ProRealTime, IG - compiled by Chris Beauchamp
| Change in | Longs | Shorts | OI |
| Daily | -1% | 2% | 1% |
| Weekly | 12% | -7% | -1% |
Nasdaq on the back foot
After last week’s recovery, upside progress has stalled, but the index remains within easy distance of fresh record highs.
Last week saw a brief dip towards 16,630, with buyers emerging to defend this level. Thus a close back below this may provide some short-term bearishness, towards the 50-day SMA.
Conversely, a close back above 16,980 would leave the index in fresh record territory.
US Tech 100 Daily Chart
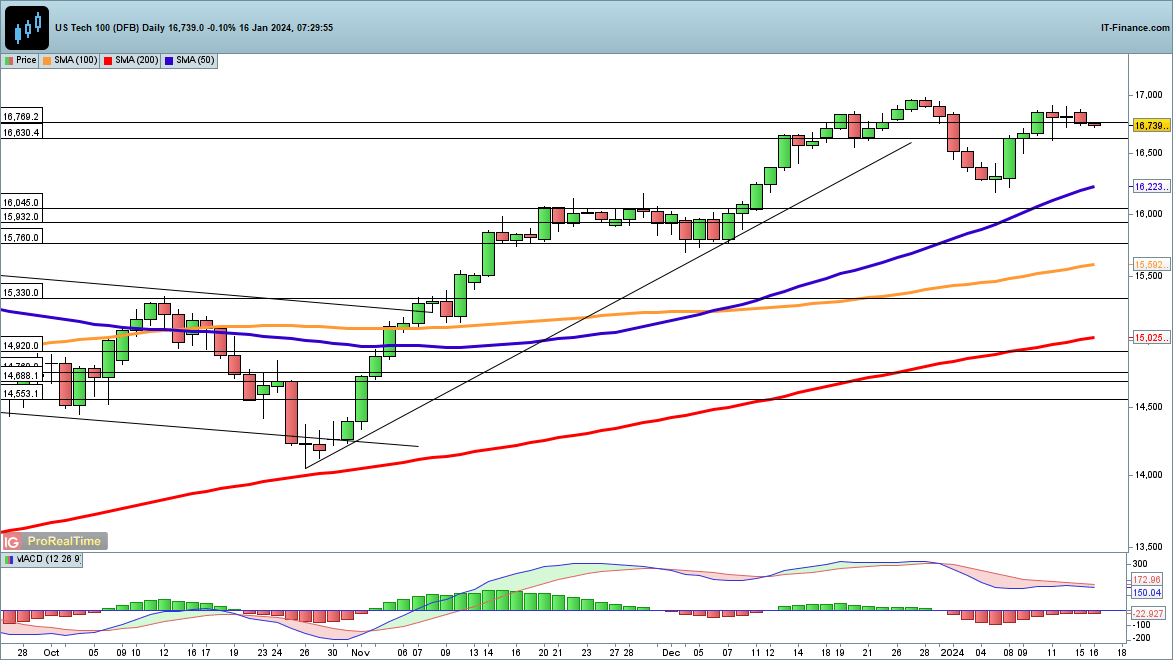
Source: ProRealTime, IG - compiled by Chris Beauchamp
Hang Seng hits 14-month low
The index continues to tiptoe towards new lows in its current downtrend.
Further downside seems likely, with the break below 16,000 to a fourteen-month low bolstering the bearish view. Now it continues to eat into the gains made in November 2023, in the direction of the 2022 low around 14,620.
A close back above 16,450 is needed to suggest a fresh short-term rebound may have begun.
HS50 (Hang Seng) Daily Chart
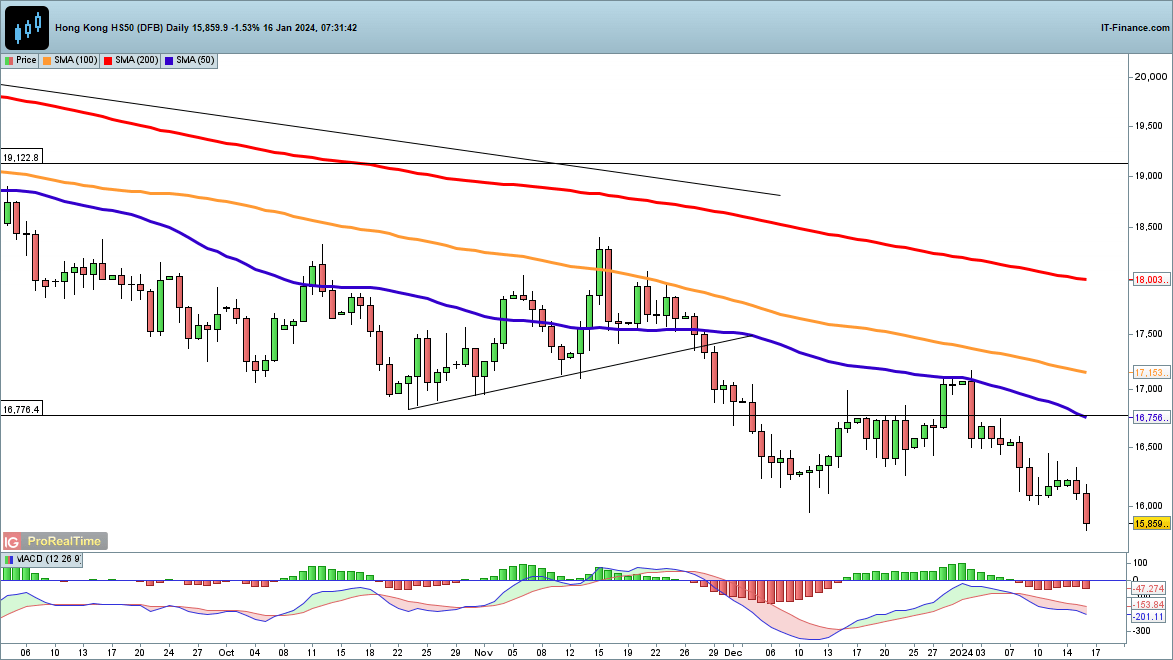
Source: ProRealTime, IG - compiled by Chris Beauchamp
Trade Smarter - Sign up for the DailyFX Newsletter
Receive timely and compelling market commentary from the DailyFX team