


Strong Momentum Likely to Wane in Q3 as the Fed Awaits Incoming Data
US equity indices are on track to close out Q2 in positive territory thanks to outperformance from Nvidia, which temporarily saw it claim the title of the largest stock in the US when measured by market cap. Tech-heavy indices like the Nasdaq and S&P 500 have risen over the quarter but the relatively deep pullback at the start of the period has hampered the overall rise during the three-month period.
Mega Cap Tech Stocks Q2 Performance (01/04/2024 – 21/06/2024)
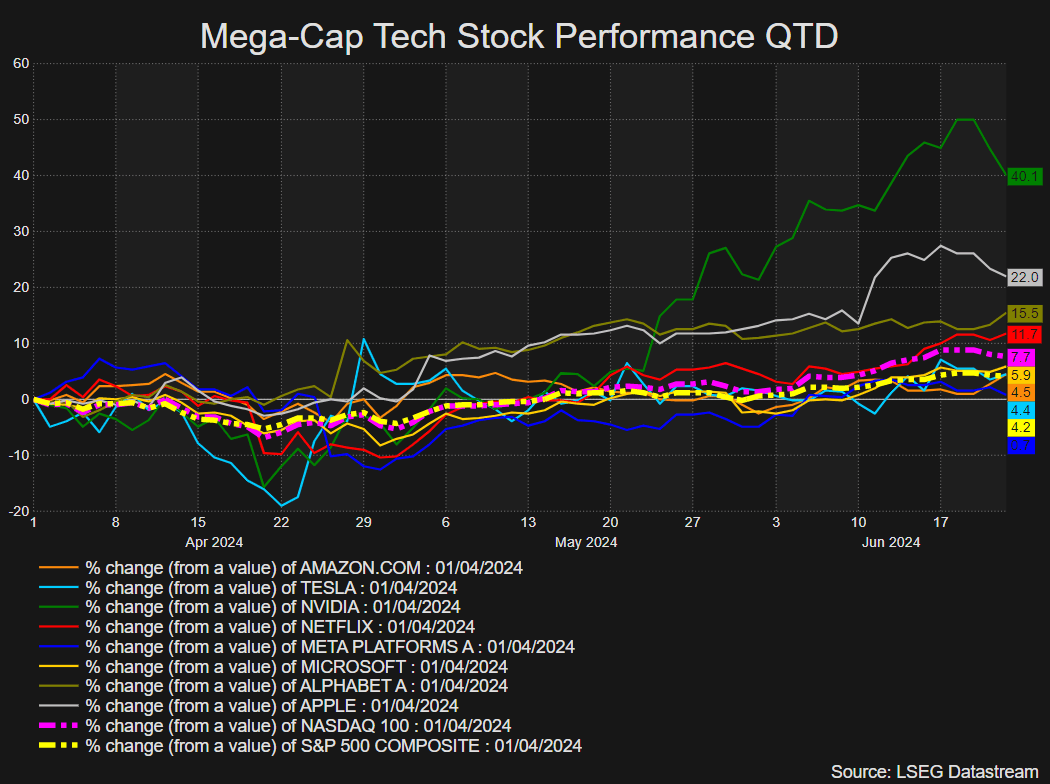
Source: Rifinitiv, Prepared by Richard Snow
The question on everyone’s mind revolves around whether a handful of significant companies will be able to pull US indices higher in the coming quarter considering the current rally is looking less inclusive with fewer stocks trading above their individual 200-day simple moving averages (SMAs). Other considerations include Q2 earnings results which will filter in from July, delayed rate cuts signaled by the Fed, and the run up to the US presidential election.
A Less Inclusive Rally is not Necessarily Bearish but can Slow Momentum
There has been a lot of discussion around the sustainability of the bullish trend in tech-heavy indices as there has been a drop off in the number of stocks trading above their long-term averages. The measure has dropped from above 80% to less than 68%.
As can be seen from the chart below, whenever the percentage of S&P 500 stocks trading above their 200 SMAs drop from 80%, there is more likely than not a further deterioration in share prices for the majority of index. In 2018, 2020 and 2022 the percentage of stocks above their 200 SMAs stalled and reversed, coinciding with a lower reading for SPX at the end of each year.
However, as we’ve seen in 2023, stock markets can still rally despite fewer stocks taking part and this is a phenomenon that has become more apparent recently with the rise of Nvidia – taking the total market cap of the top 5 stocks in the index to over 25%. As long as the heavyweight stocks perform well, the index is able to hold up even if the majority of stocks stagnate or experience shallow pullbacks.
Measure of Market Breadth for the S&P 500 (% of SPX stocks trading above their 200 SMAs)
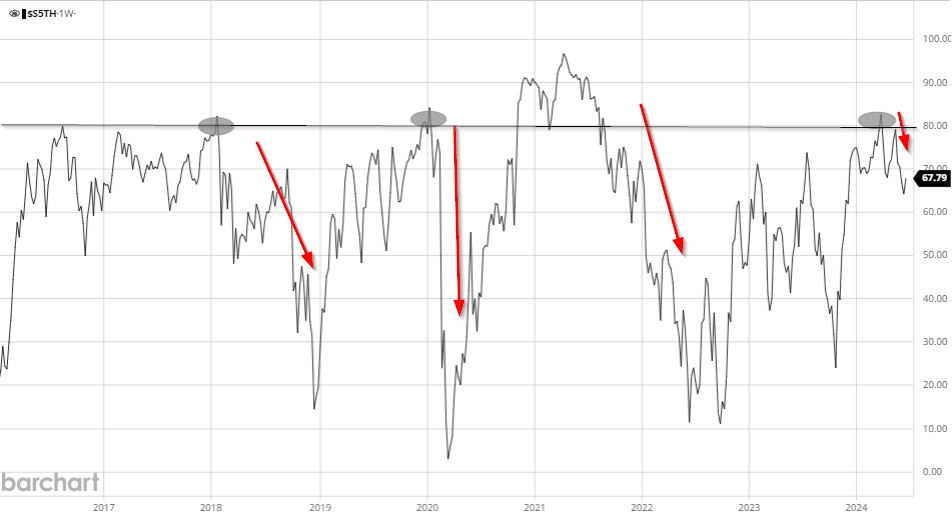
Source: Barchart, prepared by Richard Snow
After acquiring a thorough understanding of the fundamentals impacting US equities in Q3, why not see what the technical setup suggests by downloading the full US equities forecast for the third quarter?

Q2 Equity Earnings and The Fed Delays Rate Cuts due to Inflation Concerns
US earnings season for the second quarter kicks off in the first week of July and appears likely to mirror the generally positive results witnessed over Q1. In fact, analysts have slightly raised their full year forecast for earnings growth from 11.2% to 11.3% in 2024 in stark contrast to the meagre 1% figure that materialised in 2023.
S&P 500 Projected Earnings Growth 2024 by Sector
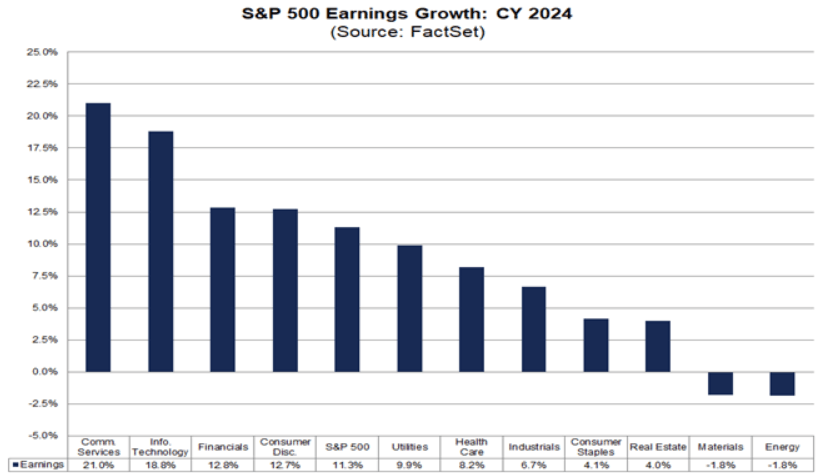
Source: FactSet, prepared by Richard Snow
The longer-term outlook appears positive, with double digit earnings growth expected to extend into 2025, increasing the likelihood of a soft landing when the Fed eventually acquires sufficient confidence to lower the interest rate.
Thus far equity markets have proven robust, printing all-time highs despite rate cuts constantly being pushed back due to stubborn inflation. The Fed raised its inflation expectations when the updated forecasts were released at the June FOMC meeting and indicated that it plans to lower the Fed funds rate just once this year, down from three projected in March but the decision between one or two cuts was a very close one. Markets recently underwent a hawkish repricing (as seen in the chart below), which could keep equity gains capped in Q3 before the picture changes in Q4 when that first Fed cut is anticipated. Inflation prints for June and July will be crucial in the assessment of a potential cut in September, but for now, markets fully price in a cut by November.
If this remains the case, Q3 may see limited gains on the equity front with indices rising towards the end of the quarter unless the September FOMC meeting becomes more favourable. Such a scenario is likely to buoy equities sooner. Keep in mind the independent Fed typically avoids policy adjustments in an election month to distance itself from any accusations of political interference. That leaves September and December as the only viable months if we are to get two rate cuts this year.
Implied Yield for CBoT 30-Day Fed Funds Futures Curves
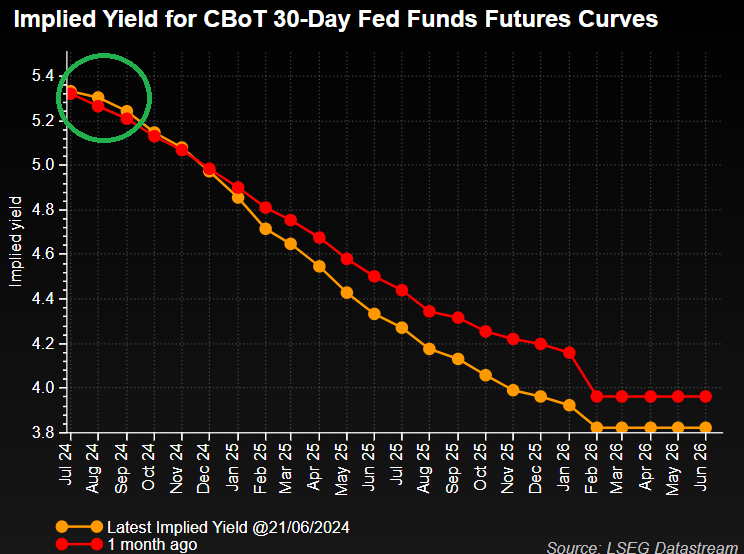
Source: Rifinitiv, Prepared by Richard Snow
What Does Seasonality in an Election Year Reveal for the S&P 500?
Generally speaking, election years are great for the stock market. Data going as far back as 1949 sees a typical election year adding around 7% on average, while years involving a sitting president running for reelection have climbed nearly 13% on average. We’re only halfway through 2024 and already seeing gains of 15% towards the end of June. July and August tend to consolidate or exhibit a slight rise before September sees a broader continuation of the yearly bull trend. If incoming inflation data shows significant progress, the seasonal uptick in the S&P 500 in September may coincide with an increased expectation of a full 25 basis point cut from the Fed.
Seasonal Trajectories for the S&P 500 under Different Scenarios During an Election Year
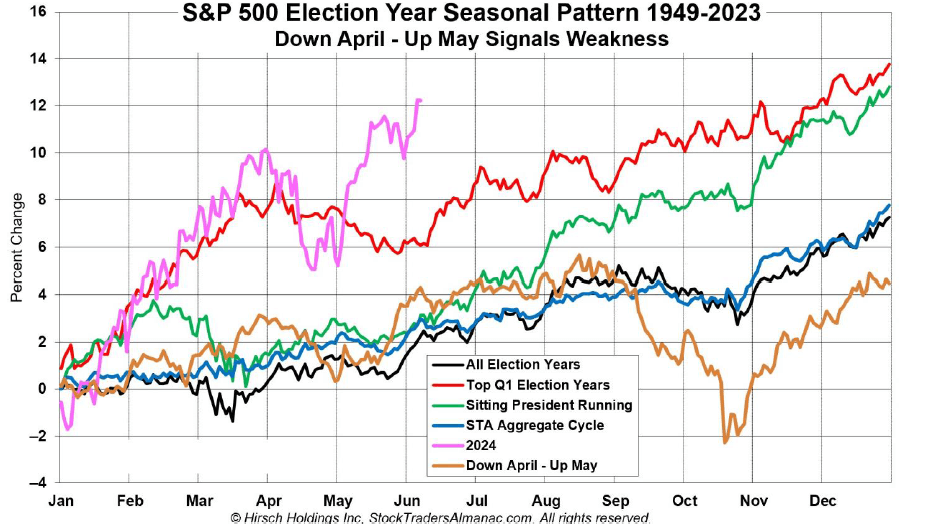
Source: Hirsch Holdings Inc, X via @AlmanacTrader
Fundamental Summary for Equities in Q3:
The outlook for US indices is still bullish, but headwinds like stubborn inflation data, inflation expectations, a less inclusive rally, and a seasonal consolidation limit the extent that indices are likely to rise in Q3. One last thing to note according to the latest Bank of America Global Fund Manager Survey is that investor sentiment is overwhelmingly positive, with 64% of respondents predicting a ‘soft landing’ and 26% indicating a ‘no landing’ scenario.


