

Ethereum (ETH) Prices, Charts, and Analysis:

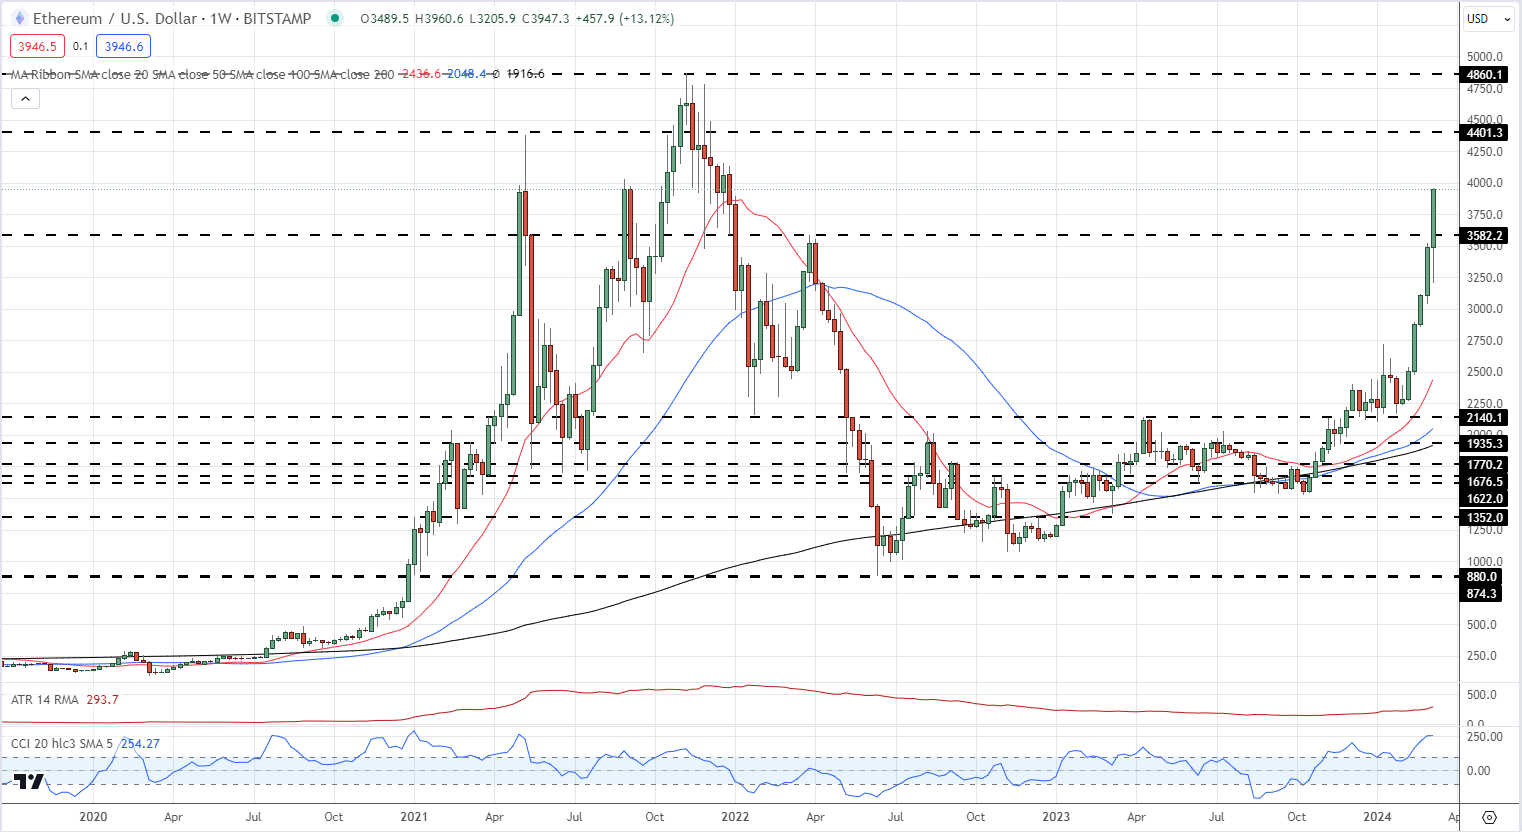
Ethereum has rallied by over 80% since the January 23rd low print at $2,165 producing a fairly constant series of higher highs and higher lows. The one major short-term sell-off on Tuesday, March 5th was quickly recovered, underpinning the recent strength of the move, and an attempt on the $4k ’big figure’ resistance level seems likely as long as current market sentiment remains upbeat. As always with an asset class as volatile as the cryptocurrency sector, strong risk management is needed.
Today’s US Jobs Report can move a range of asset classes, including the cryptocurrency space, in either direction so attention to the 13:30 release is needed.
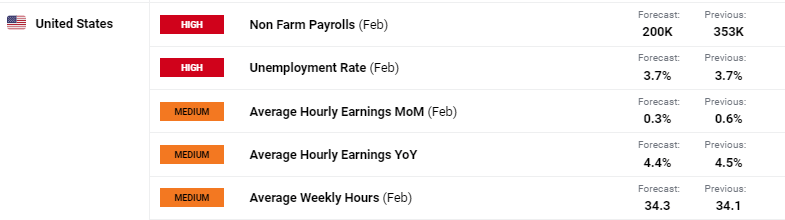
For all market-moving economic releases and events, see the DailyFX Economic Calendar
The weekly Ethereum chart shows the strength of the recent move and this has taken ETH into heavily overbought territory using the CCI indicator at the bottom of the chart. This needs to be normalized to allow Ethereum to continue to move higher. Above $4k a series of descending highs from October 2021 appear ahead of the mid-May 2021 swing high at $4,400. Above here, the all-time high at $4,860 comes into focus. Initial support on the weekly chart at $3,585.

Ethereum Weekly Price Chart
Ethereum Spot ETF – The Next Cab Off the Rank?
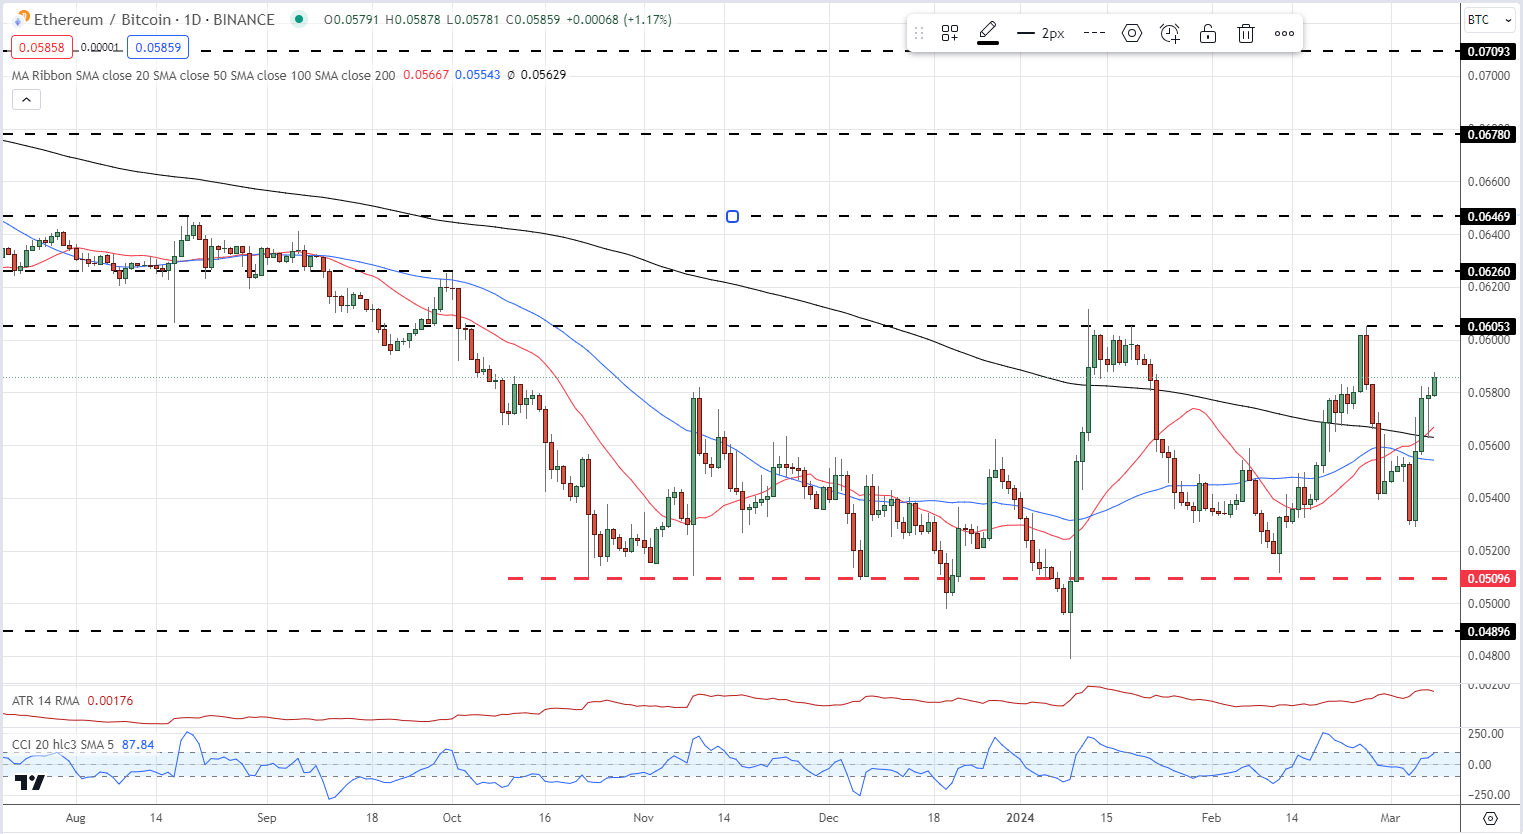
Ethereum has outperformed Bitcoin this week, regaining a substantial portion of the underperformance seen this year. Resistance at the 0.6050 area has held since early January and may do so again at the next attempt, but a break above here brings 0.6260 back into focus. ETH/BTC is back above all three simple moving averages, and while the CCI indicator is closing in on an overbought reading it remains well below the two heavily overbought readings seen this year.
Ethereum/Bitcoin Daily Spread Chart
All charts via TradingView
What is your view on Ethereum – bullish or bearish?? You can let us know via the form at the end of this piece or you can contact the author via Twitter @nickcawley1.