


Weekly Technical Trade Levels on USD Majors, Commodities & Stocks
- Technical setups we’re tracking into the weekly open
- Key levels for the US Dollar Majors, Gold, S&P 500, Crude Oil and more!
- New to Gold Trading? Get started with this Free How to Trade Gold -Beginners Guide
In this webinar we take an in-depth look at the technical trade levels for US Dollar (DXY), Euro (EUR/USD), British Pound (GBP/USD), Canadian Dollar (USD/CAD), Japanese Yen (USD/JPY), Australian Dollar (AUD/USD), Gold (XAU/USD), Silver (XAG/USD), S&P 500 (SPX500), Nasdaq (NDX), Dow Jones Industrial Average (DJI), Crude Oil (WTI) and Bitcoin.
You can always find the latest Weekly Strategy Webinar on my YouTube playlist.
Euro Price Chart – EUR/USD 240min
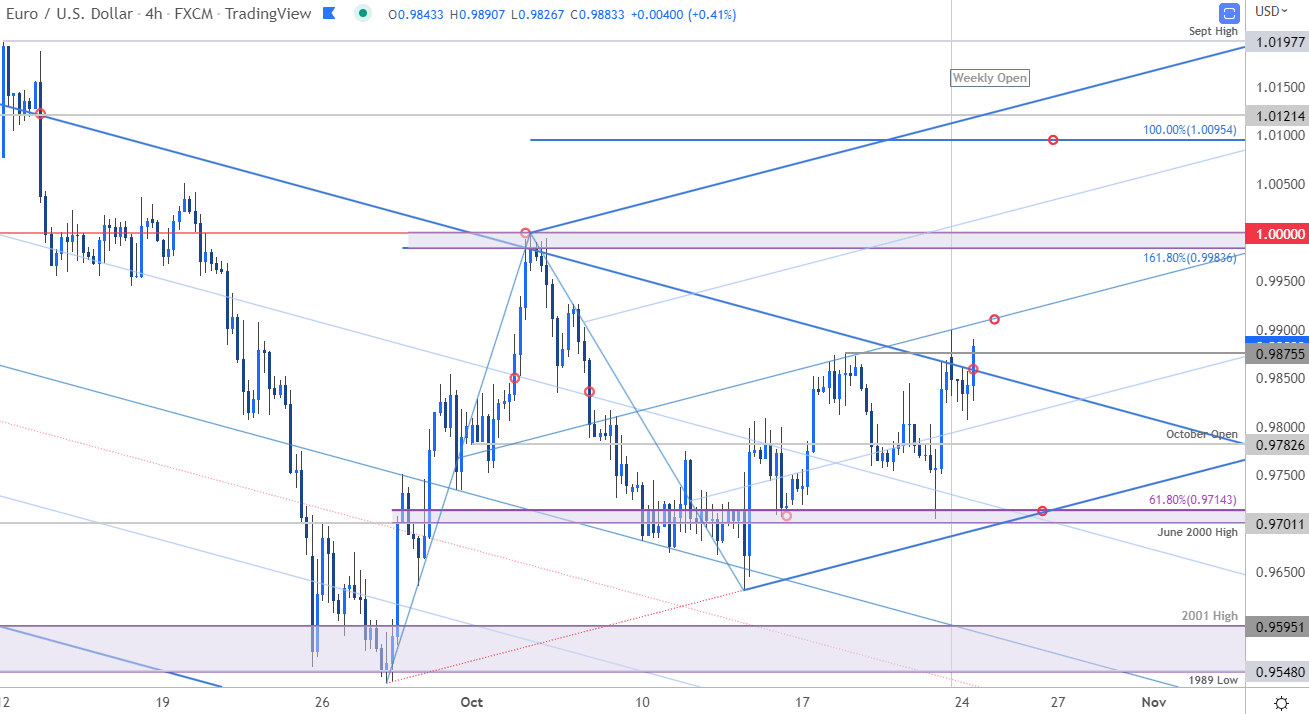
Chart Prepared by Michael Boutros, Technical Strategist; EUR/USD on Tradingview
Euro is attempting to breach yearly downtrend resistance early in the week. A newly identified upslope may be in play here, keeping the threat higher while above 9700. A topside breach above the median-line would expose key resistance into the monthly range highs at parity- look for a larger reaction in price there IF reached.
British Pound Price Chart - GBP/USD Daily
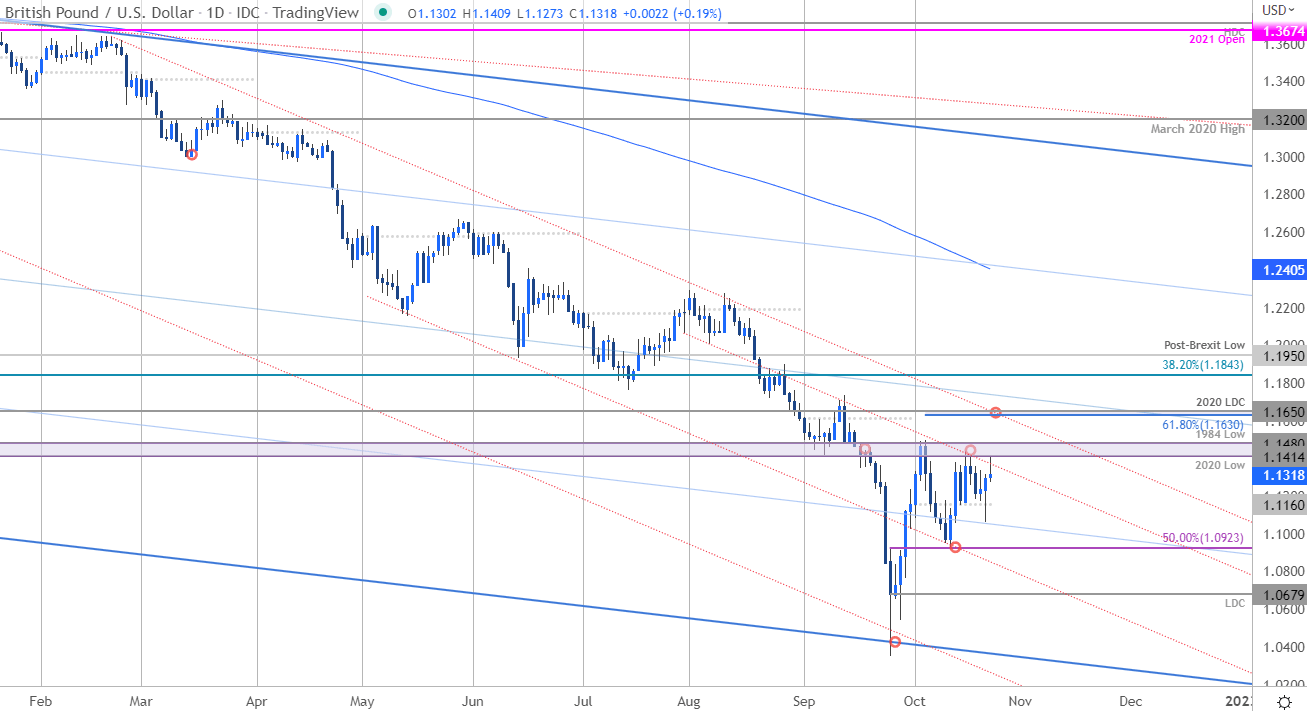
Chart Prepared by Michael Boutros, Technical Strategist; GBP/USD on Tradingview
Sterling has continued to reinforce the significance of the pending range breakout with the immediate focus on key resistance at the October highs here at 1.1414/80. Monthly open support rests at 1.1160 backed by the monthly range lows at 1.0923. Ultimately, the threat remains for a larger recovery towards the yearly downtrend / confluent resistance at 1.1630/50- an area of interest for possible exhaustion / price inflection IF reached. Review my latest British Pound Weekly Technical Forecast for closer look at the longer-term GBP/USD trade levels.
S&P 500 Price Chart – SPX500 240min Chart
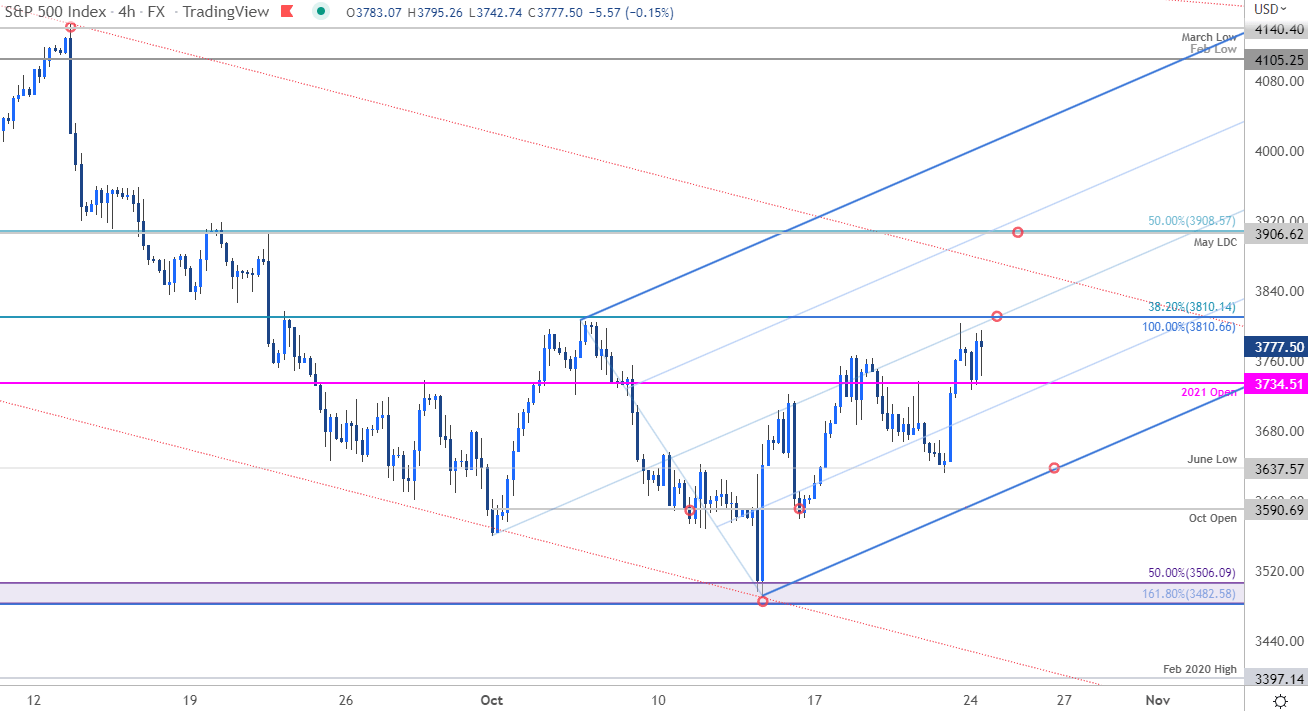
Chart Prepared by Michael Boutros, Technical Strategist; SPX500 on Tradingview
Steady as she goes! The S&P 500 is approaching confluent resistance at 3810 early in the week- looking for a reaction here IF reached with a close above needed to keep the focus on 3906/08. While the near-term slope keeps the index constructive, I’m on the lookout for possible topside exhaustion / price inflection on a stretch towards 3906/08 IF reached. Initial support now 3734 with near-term bullish invalidation raised to Friday’s low / June low at 3631/37. Review my latest SPX500 Short-term Technical Outlook for a closer look at this S&P 500 setup.
For a complete breakdown of Michael’s trading strategy, review his Foundations of Technical Analysis series on Building a Trading Strategy
Economic Calendar
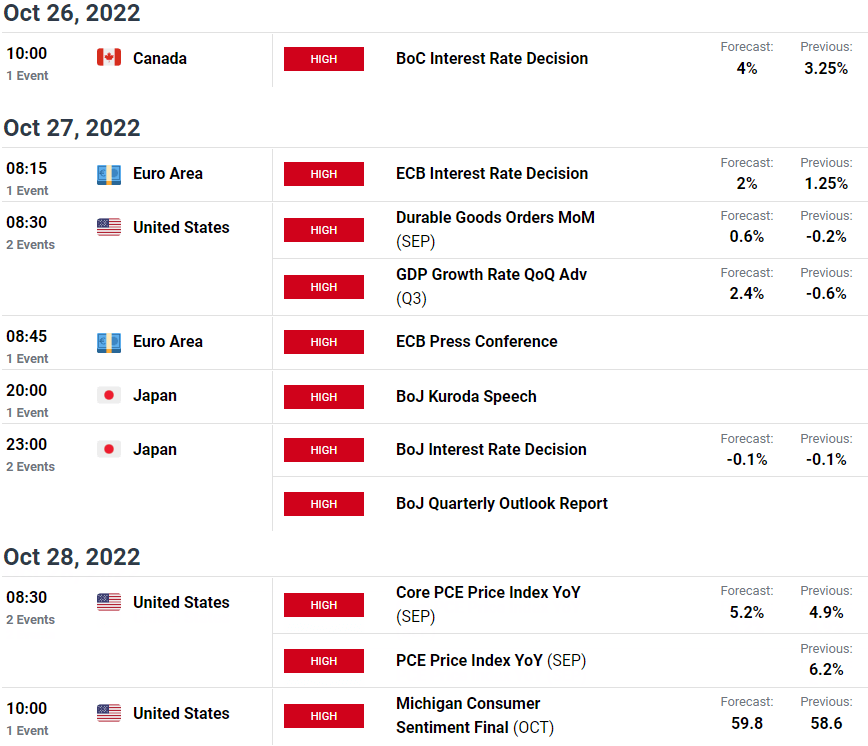
Economic Calendar - latest economic development and upcoming event risk

---Written by Michael Boutros, Technical Strategist with DailyFX
Follow Michael on Twitter @MBForex


