EUR/USD, EUR/GBP Prices, Charts, and Analysis
- EUR/USD trading on either side of 1.0800, helped by US dollar weakness.
- EUR/GBP bounces off support and is looking to print a fresh multi-month high.

Most Read Euro Weekly Forecast: EUR/USD, EUR/GBP, EUR/JPY – Analysis and Forecasts
The economic calendar has a few interesting releases this week, including the latestEuroArea and German PMI reports, the German Ifo, and final Euro Area inflation and German GDP numbers. In addition, several ECB board members will their latest views on the economy over the week, while the latest US FOMC minutes will also be worth following.
For all market-moving economic data and events, see the real-time DailyFX Economic Calendar
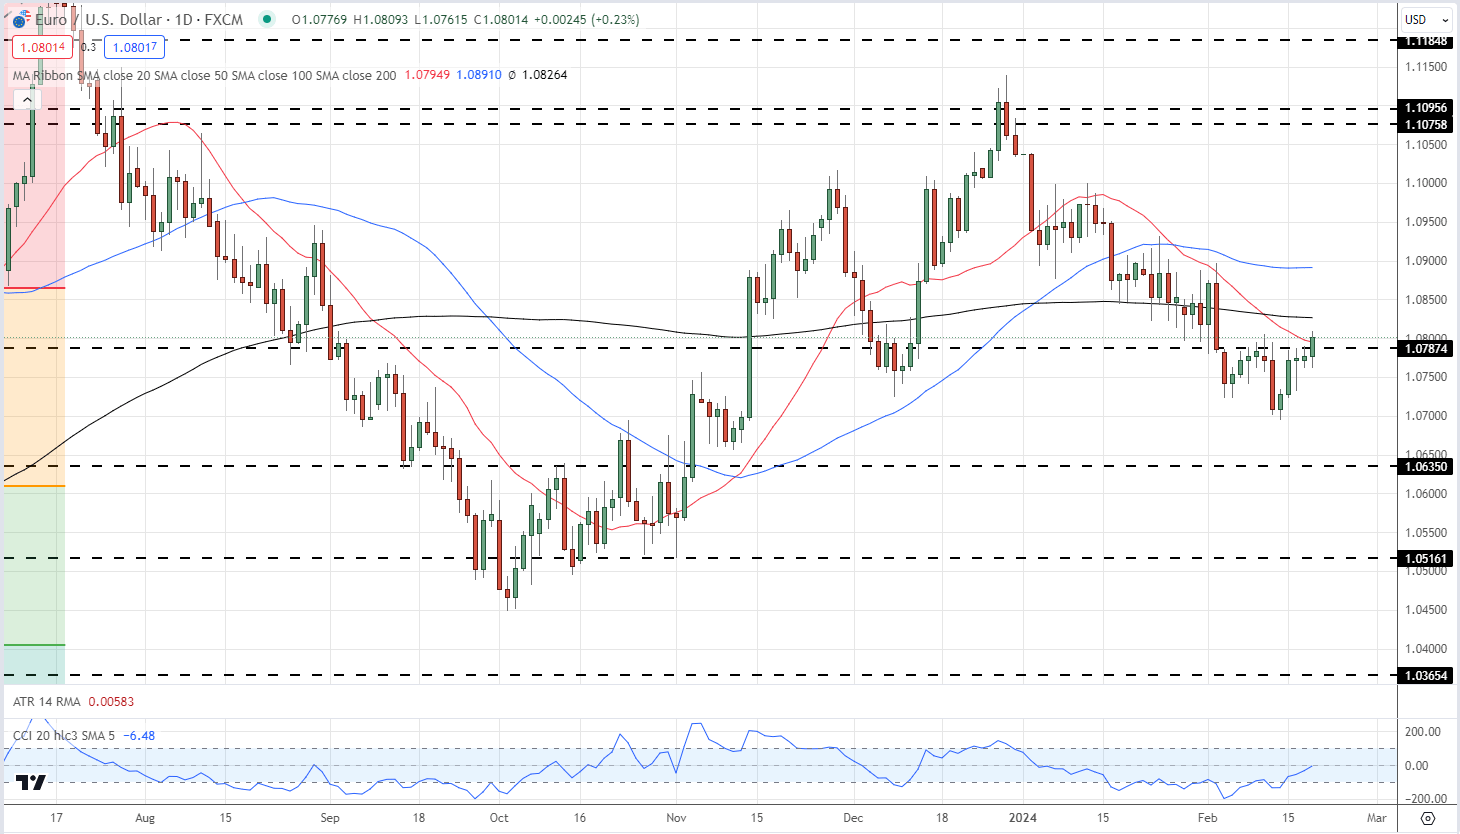
The Euro is moving marginally higher as we head into the US open, while the greenback is marginally lower. The US dollar index is currently trading around 104.20 after hitting a multi-week high of 105.02 last Wednesday. The reverse can be seen in EUR/USD which now changes hands around 1.0800 after touching 1.0700 last week. The pair have broken through a cluster of recent resistance on either side of 1.0787 and EUR/USD is now testing the 20-day simple moving average at 1.0795. The next target is seen at 1.0826, the 200-day sma, before the 23.6% Fibonacci retracement level at 1.0862.
EUR/USD Daily Chart
Charts Using TradingView
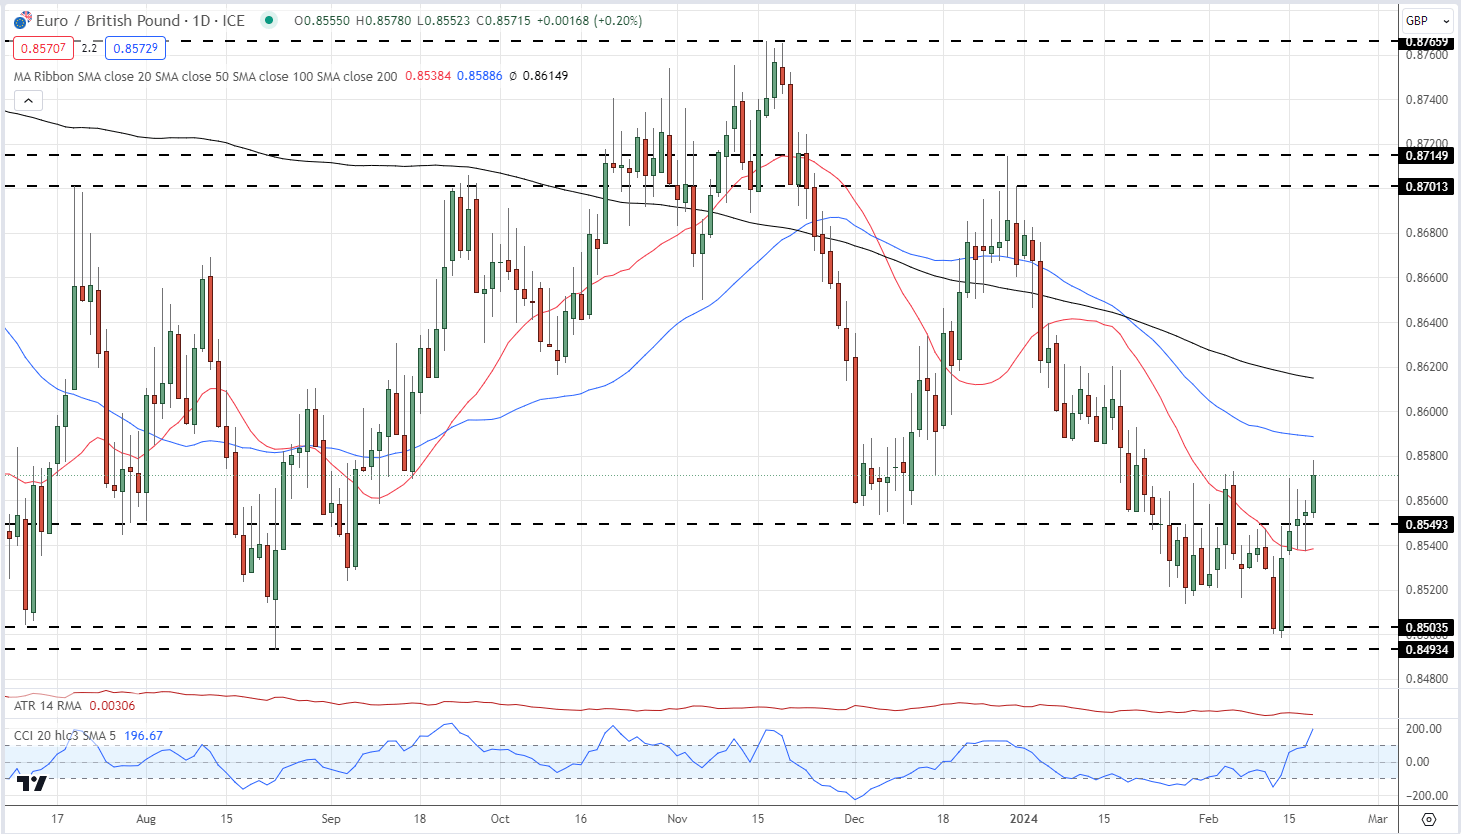
EUR/GBP has made a solid rebound off a prior level of support around 0.8500 and broken through both the 20-day sma at 0.8538 and a prior level of support turned resistance at 0.8549. The next level of resistance comes off the 50-day sma at 0.8588. The pair are looking overbought with the CCI indicator at the highest level since late-October last year.
EUR/GBP Daily Chart
IG retail trader data show 67.52% of traders are net-long with the ratio of traders long to short at 2.08 to 1.The number of traders net-long is 0.81% higher than yesterday and 9.76% lower than last week, while the number of traders net-short is 15.38% higher than yesterday and 42.86% higher than last week.
To See What This Means for EUR/GBP, Download the Full Retail Sentiment Report Below
| Change in | Longs | Shorts | OI |
| Daily | -2% | -4% | -3% |
| Weekly | -5% | -7% | -6% |
What is your view on the EURO – bullish or bearish?? You can let us know via the form at the end of this piece or you can contact the author via Twitter @nickcawley1.