Article by IG Senior Market Analyst Axel Rudolph
FTSE 100, DAX 40, Dow Jones Analysis and Charts
FTSE 100 still hovers above support
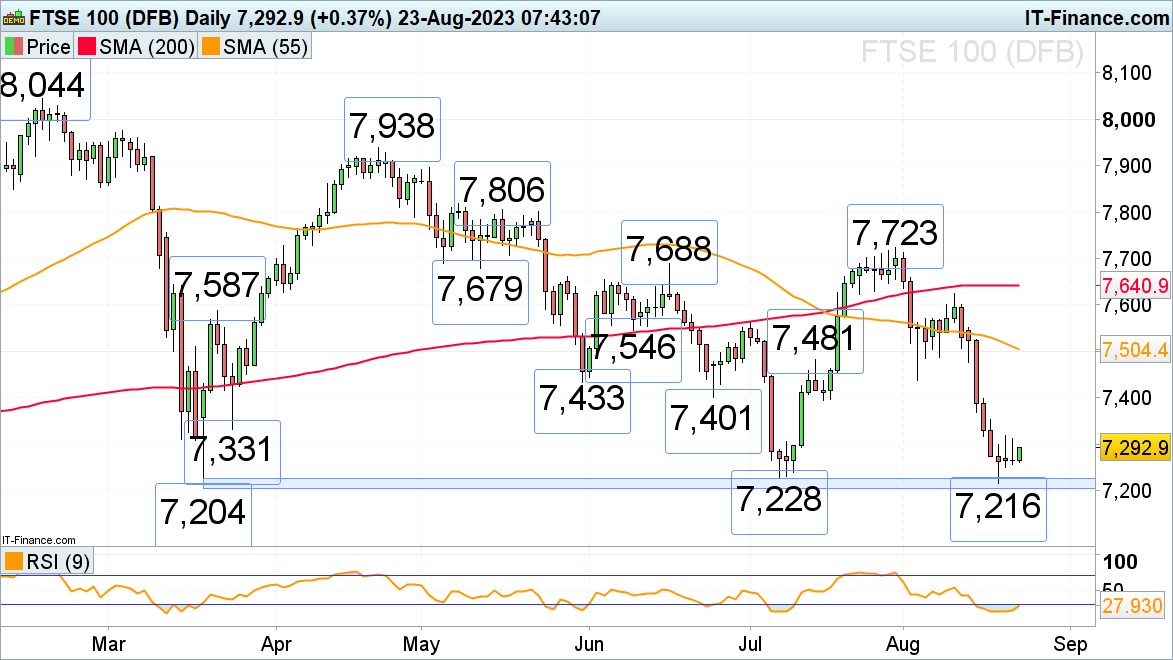
The FTSE 100 continues to precariously range trade in low volatility above its March and July lows at 7,228 to 7,204 which represents significant support ahead of Wednesday’s UK manufacturing and services flash PMI reading for August. Further low volatility trading above the 7,228 to 7,204 major support area is expected to take place before Nvidia publishes its results after the bell in the U.S. later today.
Minor resistance remains to be seen between Monday’s 7,317 high and the 24 March low at 7,331. More significant resistance sits between the May and June lows at 7,401 to 7,433.
FTSE 100 Daily Chart

DAX 40 continues to advance
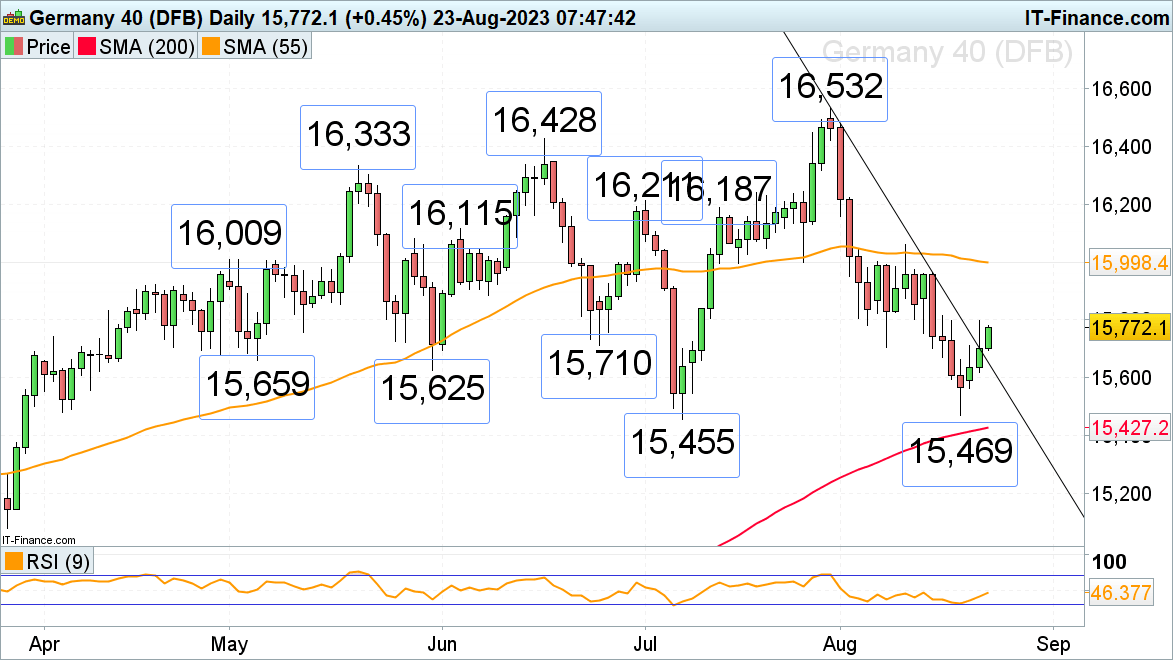
The DAX 40’s advance in the course of this week is showing no signs of slowing down with Tuesday’s high at 15,798 being eyed. A rise above this level would engage the 55-day simple moving average (SMA) at 15,998. While the index remains below the next higher 10 August high at 16,062, overall downside pressure remains in play, though.
Minor support below Monday’s high at 15,711 come sin along the breached July-to-August downtrend line at 15,650 and at Tuesday’s 15,620 low. More significant support remains to be seen between the July and current August lows and the 200-day simple moving average (SMA) at 15,469 to 15,427.
DAX 40 Daily Chart
How does IG Client Sentiment affect price action?
| Change in | Longs | Shorts | OI |
| Daily | 4% | 6% | 6% |
| Weekly | -18% | 17% | 5% |
The Dow Jones Industrial Average still tries to stabilize
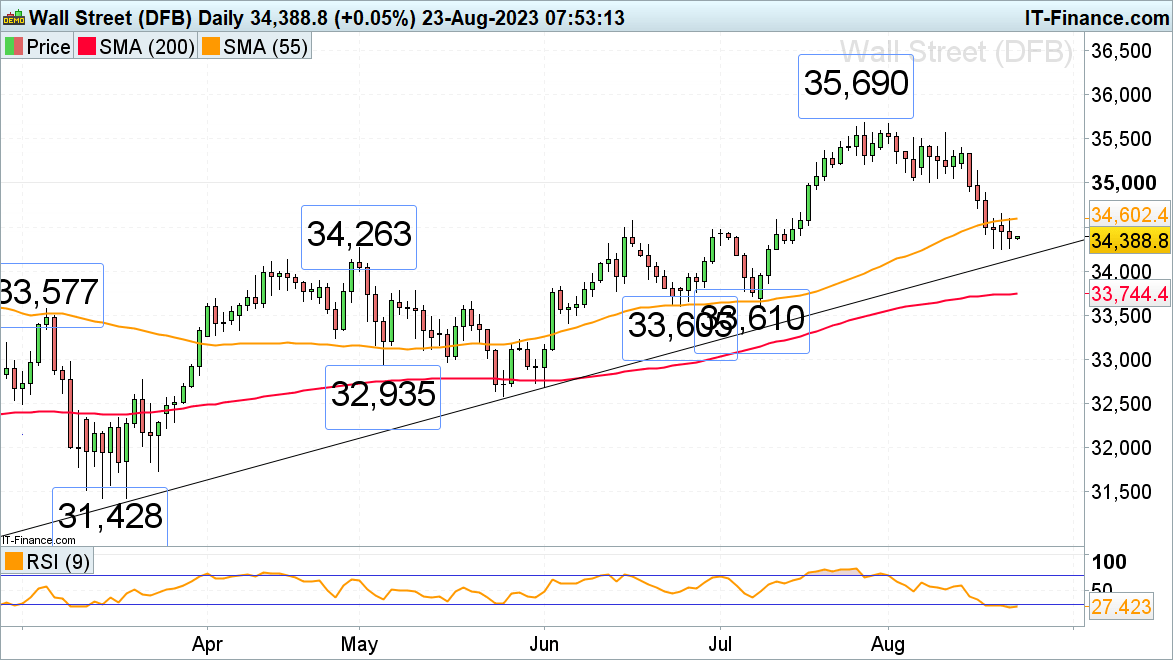
The Dow Jones Industrial Average has been subdued this week and keeps on trying to find support around Monday’s low at 34,249 in low volatility and volume trading ahead of Thursday’s Jackson Hole symposium and today’s US manufacturing and services flash PMI data for August. Nvidia’s after-hours earnings will probably also have an impact on the Dow but this should be seen on Thursday.
Key support is the October-to-August uptrend line at 34,145, a fall through which would probably lead to the March high, June and July lows as well as the 200-day simple moving average (SMA) at 33,744 to 33,577 to be reached.
Minor resistance can be spotted between the 55-day simple moving average (SMA) and Monday’s high at 34,602 to 34,649. If it and the June peak at 34,574 were to be bettered, the 35,000 region would likely be back in play.
Dow Jones Daily Chart
Introduction to Technical Analysis
Candlestick Patterns
Recommended by IG