
USD/JPY TECHNICAL ANALYSIS
USD/JPY took a quick plunge early last week, but found solid footing just above technical support at 146.00. This resilience led to a swift recovery in subsequent trading sessions, with the pair steadily trekking upwards in recent days, seemingly intent on challenging channel resistance located around the psychological 148.00 level.
Throughout this month, USD/JPY has struggled to breach the 148.00 threshold, as shown in the chart below. Every effort made by the bulls to take out this ceiling has been met with rejection, indicative of a notable cluster of sellers in this region. With that in mind, a similar outcome may play out during a retest, but we could see a rally towards 148.80 on a breakout, followed by a move towards 150.00.
In the event the bears regain control of the market and trigger a meaningful pullback, initial support is located at 145.90. On further weakness, the focus shifts lower to 144.55 and 143.85 thereafter. It's worth noting, though, that the bearish scenario is poised to encounter significant headwinds, particularly with U.S. Treasury yields sitting at multi-year highs.
Enhance your trading prowess and seize a competitive advantage. Secure your copy of the yen's outlook today for exclusive insights into the key risk factors influencing the Japanese currency!

USD/JPY TECHNICAL CHART
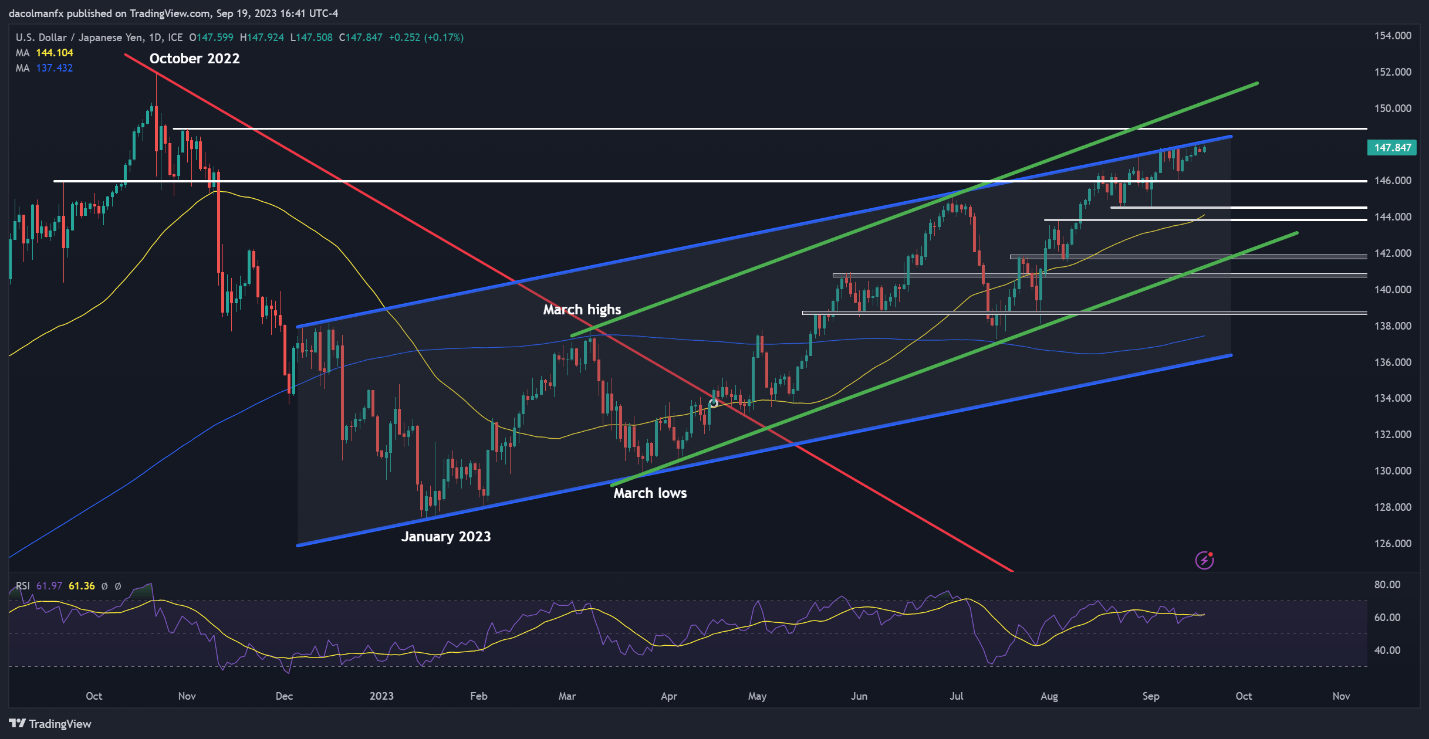
USD/JPY Chart Prepared Using TradingView
Trade Smarter - Sign up for the DailyFX Newsletter
Receive timely and compelling market commentary from the DailyFX team
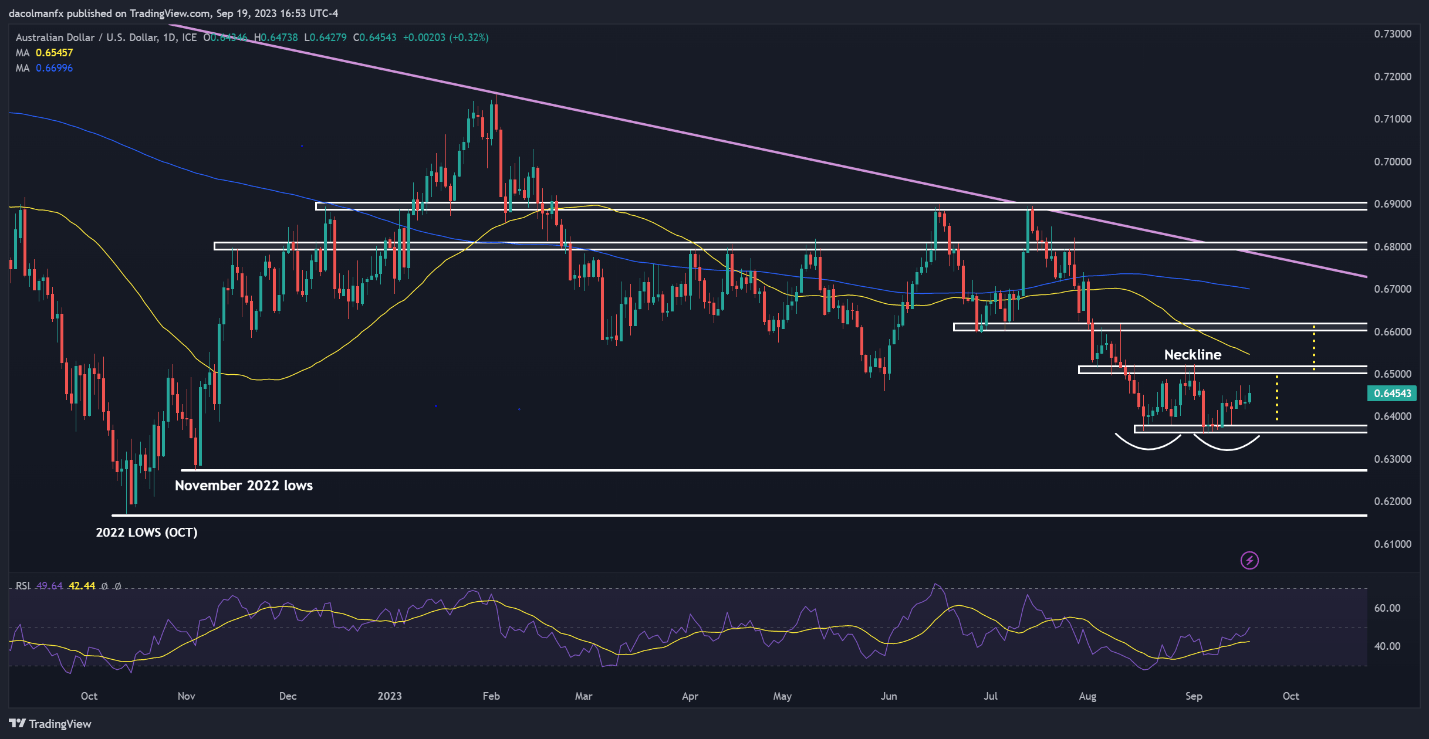
AUD/USD TECHNICAL ANALYSIS
AUD/USD advanced on Tuesday, up about 0.3% to 0.6455 in late afternoon trading in New York, continuing to carve out what seems to be a double bottom, a reversal pattern typically indicative of a waning selling pressure that often precedes a sustained recovery in the underlying asset.
A double bottom is a technical formation characterized by two comparable troughs divided by a peak in the middle, normally observed in the context of an extended downtrend. Confirmation of this bullish configuration takes place when the price completes the distinctive "W" shape and clears resistance at the neckline, marked by the intermediate peak.
Shifting our focus to the daily chart below, neckline resistance can be located within the range of 0.6500 to 0.6510. Upside clearance of this barrier could pave the way for a rapid ascent toward the 0.6600 mark.
Conversely, if market momentum shifts in favor of sellers and the exchange rate takes a turn to the downside, initial support rests at 0.6360. While AUD/USD may level off around this zone during a pullback, a breakdown might precipitate a significant retracement, laying the groundwork for a decline toward 0.6275, in which case the double bottom would be nullified.
Take your trading proficiency to the next level: Explore the Australian dollar's prospects through a holistic approach, combining fundamental and technical analysis insights. Grab your free quarterly guide today!

AUD/USD TECHNICAL CHART