Article by IG Senior Market Analyst Axel Rudolph
FTSE 100, CAC 40, Russell 2000, Analysis and Charts

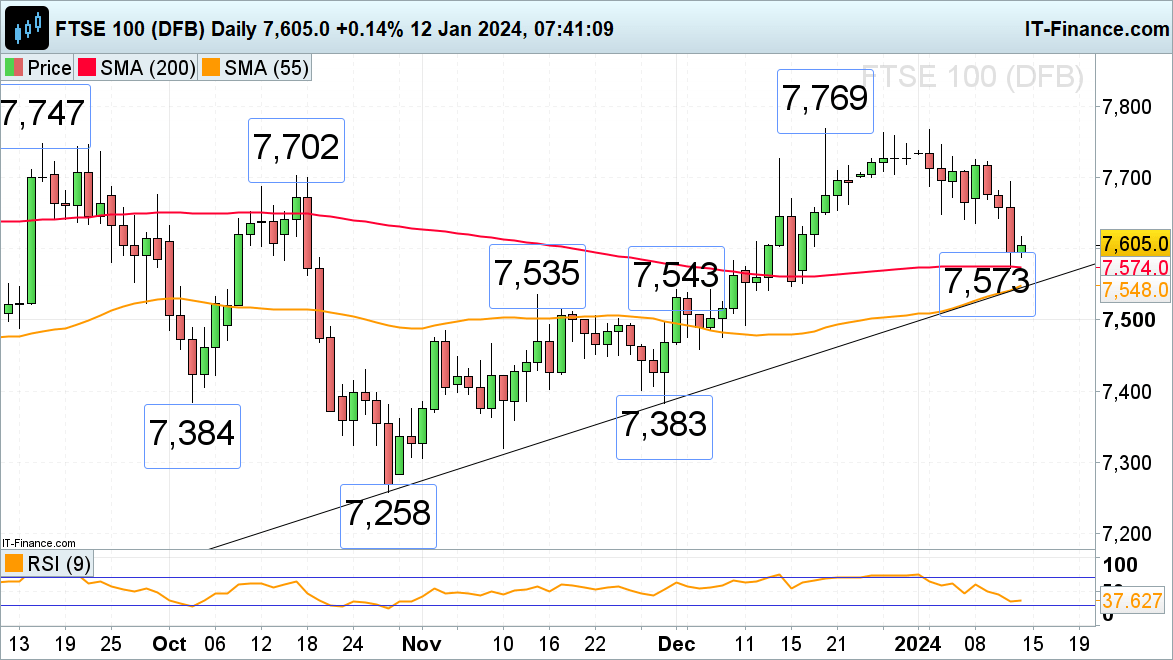
FTSE 100 tries to recover amid slightly better month-on-month GDP reading
The FTSE 100, which Thursday dropped to the 200-day simple moving average (SMA) at 7,573 on a higher-than-expected US CPI inflation reading, tries to recover on the last trading day of the week amid a decent month-on-month performance on UK GDP which was negated by a drop of the 3-month average.
Resistance sits at last week’s 7,635 to 7,647 lows ahead of Thursday’s 7,694 high. Downside pressure should remain in play while 7,694 isn’t overcome. Above it lies resistance between the September and December highs at 7,747 to 7,769.
A fall through Thursday’s 7,573 low would put the 55-day simple moving average (SMA) and October-to-January uptrend line at 7,548 to 7,546 on the map.
FTSE 100 Daily Chart
| Change in | Longs | Shorts | OI |
| Daily | 1% | 0% | 0% |
| Weekly | 0% | 0% | 0% |
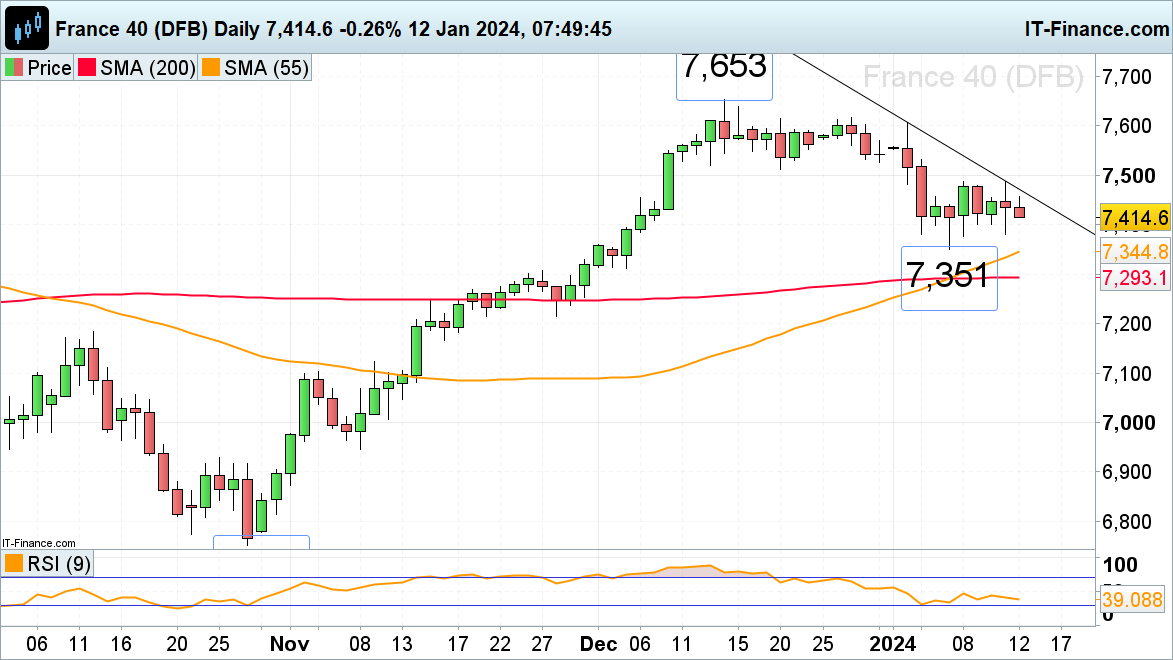
CAC 40 drops towards this week’s low
The French CAC 40 stock index continues to range trade in a tight band between 7,488 and 7,351 amid pared back rate cut expectations.
The index targets Thursday’s low at 7,415, below which lies last week’s low at 7,351. It should continue to do so while it remains above Friday’s 7,457 intraday high. This level would need to be exceeded for the recent highs 7,686 to 7,687 to be revisited.
CAC 40 Daily Chart
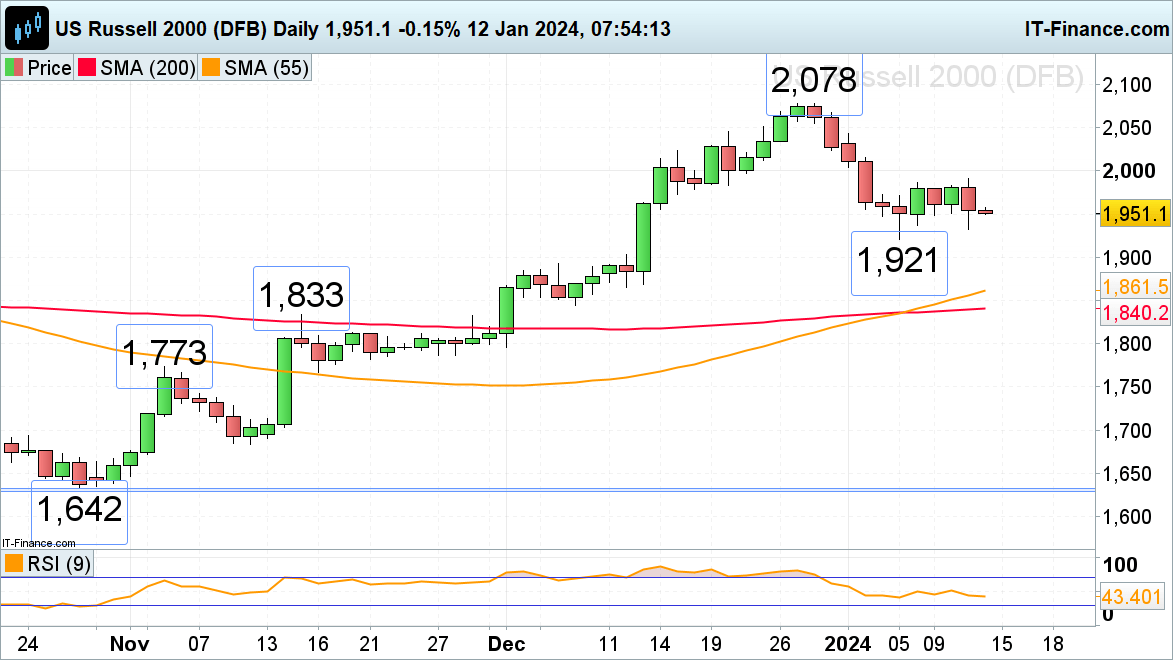
Russell 2000 slips back post higher-than-expected US CPI reading
The Russell 2000 continues to sideways trade in a relatively tight range as it awaits US PPI data and the beginning of Q4 earnings season.
Thursday’s uptick in US CPI inflation took the index back down from its one-week high at 1,992 to Thursday’s 1,933 low. This level may well be revisited on Friday, a fall through which would likely engage last week’s 1,921 low.
Resistance now sits between this week’s highs at 1,986 to 1,991 highs. This area would need to be bettered for a continuation of the medium-term uptrend to gain traction.
Russell 2000 Daily Chart