


Gold (XAU/USD) Analysis, Price, and Chart
- US inflation readings are expected to diverge.
- Gold traders need a boost of volatility as price action remains subdued.
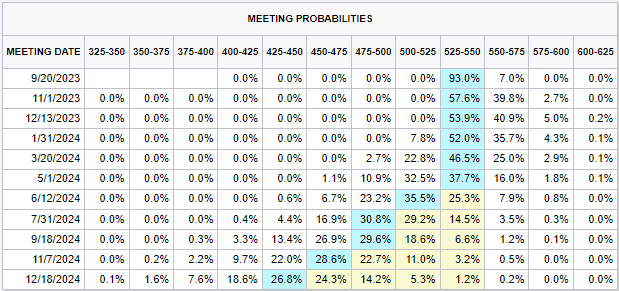
FOMC members are currently barred from making any public comments ahead of next Thursday’s Fed policy decision, leaving traders searching for any potential source of volatility to kick-start a fairly low-key market. Wednesday’s US CPI report may help boost market interest, especially as headline and core inflation are expected to diverge. Headline US inflation (August) is expected to have risen from 3.2% to 3.6%, while core inflation is forecast to have fallen from 4.7% to 4.3%. The potential rise in headline CPI will likely embolden Fed hawks who continue to back the case for another 25 basis point rate hike this year. According to the latest Fed Fund Futures probabilities, US interest rates have a 40% chance of being raised in either November or December this year to 550-575.
While the inflation report will take center stage, on Thursday both PPI and Retail Sales are released at 13:30 UK, while on Friday the September Michigan Consumer Sentiment Report hits the wires at 15:00 UK. All three releases are of high importance and need to be monitored.

Gold is currently trading around $1,920/oz. a short-term level of support made over the last five trading sessions. The 20- and 200-day simple moving averages also sit at this level, leaving the precious metal vulnerable to a further sell-off if these two indicators are broken. The CCI indicator is neutral while the 14-day ATR shows gold’s volatility at a multi-month low. Fibonacci support (38.2% retracement) comes in at $1,904/oz. ahead of big figure support at $1,900/oz. A softer-than-expected inflation print may see the precious metal test a prior zone of activity between $1,932/oz. and $1,940/oz.
Gold Daily Price Chart – September 12, 2023
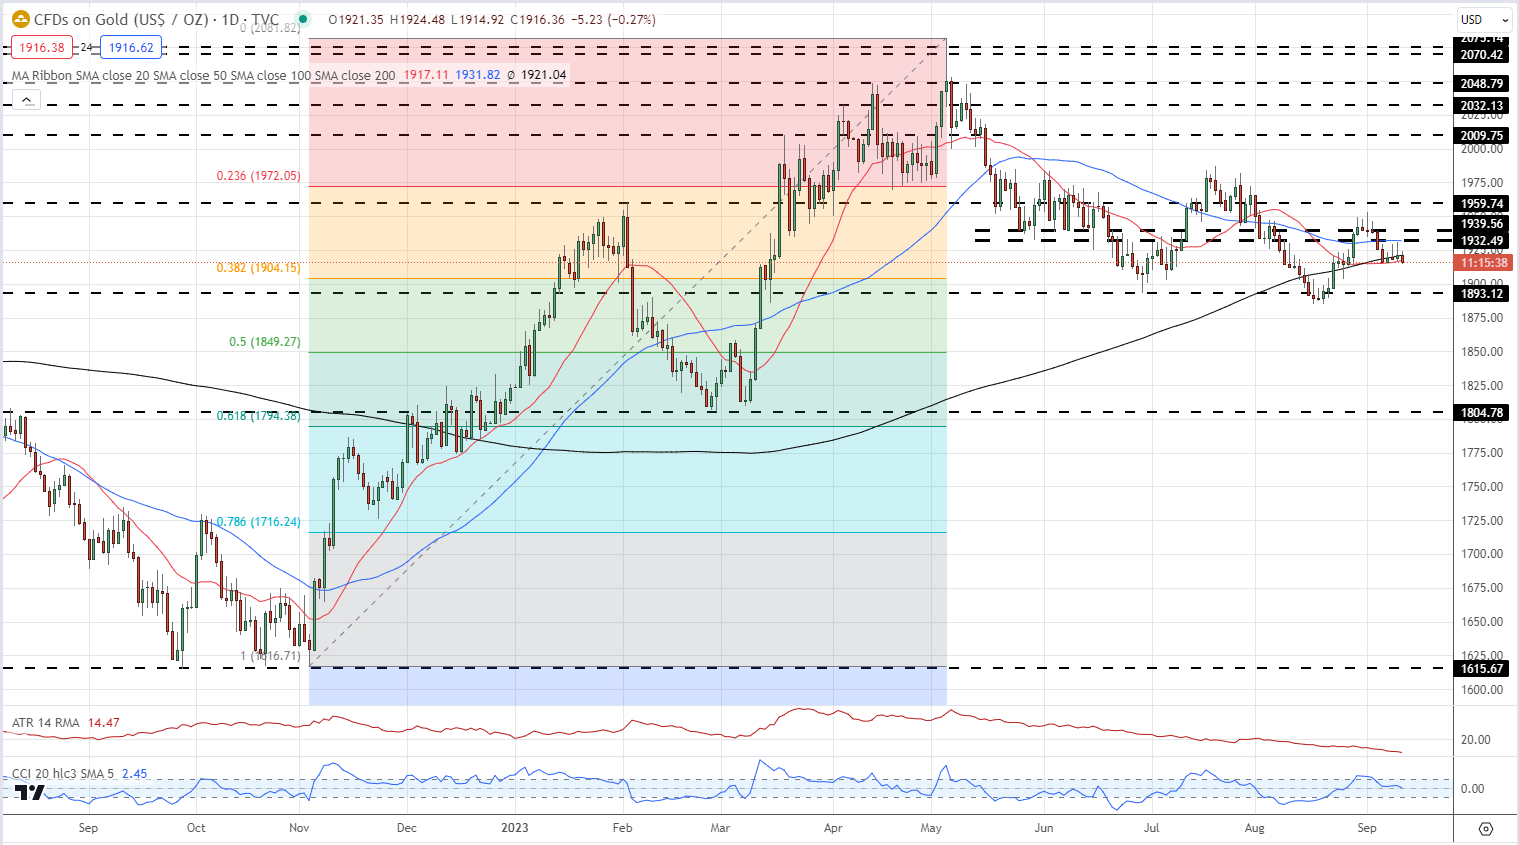
Chart via TradingView
Dowload the latest IG Gold Sentiment Report
| Change in | Longs | Shorts | OI |
| Daily | 3% | 4% | 4% |
| Weekly | -8% | 17% | 2% |
What is your view on Gold – bullish or bearish?? You can let us know via the form at the end of this piece or you can contact the author via Twitter @nickcawley1.


