


Gold (XAU/USD) Analysis and Charts
- UST 2-yr yields touch 5% after weak auction.
- Gold looks set to test Fibonacci support.
Learn how to trade gold with our complimentary guide:

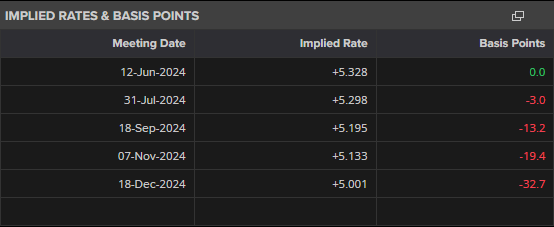
This week’s auction of 2-, 5- and 7-year US Treasuries, totaling $183 billion, met weak demand and pushed yields sharply higher over the last two days, as dealers and investors demanded more for their money. These higher UST yields, coupled with growing expectations that the Federal Reserve may only cut interest rates once this year, nudged the US dollar higher and weighed on the commodity space.
Source: LSEG Datastream.
Later in today’s session, the US Bureau of Economic Analysis (BEA) will release the 2nd look at US Q1 GDP at 13:30 UK, while on Friday the BEA will release the eagerly awaited Core PCE Price Index for April, the Federal Reserve’s preferred measure of inflation. Both can move gold.
For all market-moving economic data and events, see the DailyFX Economic Calendar
After printing a multi-decade high of $2,450/oz. last week, gold turned notably lower and currently changes hands around $2,333/oz. The daily chart shows the 23.6% Fibonacci retracement at $2,284/oz. followed closely by a prior swing low at $2,281/oz. These levels should provide a reasonable level of support in the case of any short-term sell-off. A clear break below these levels brings $2,200/oz. and the 38.2% Fibonacci retracement at $2,193/oz. into focus.
Gold Daily Price Chart
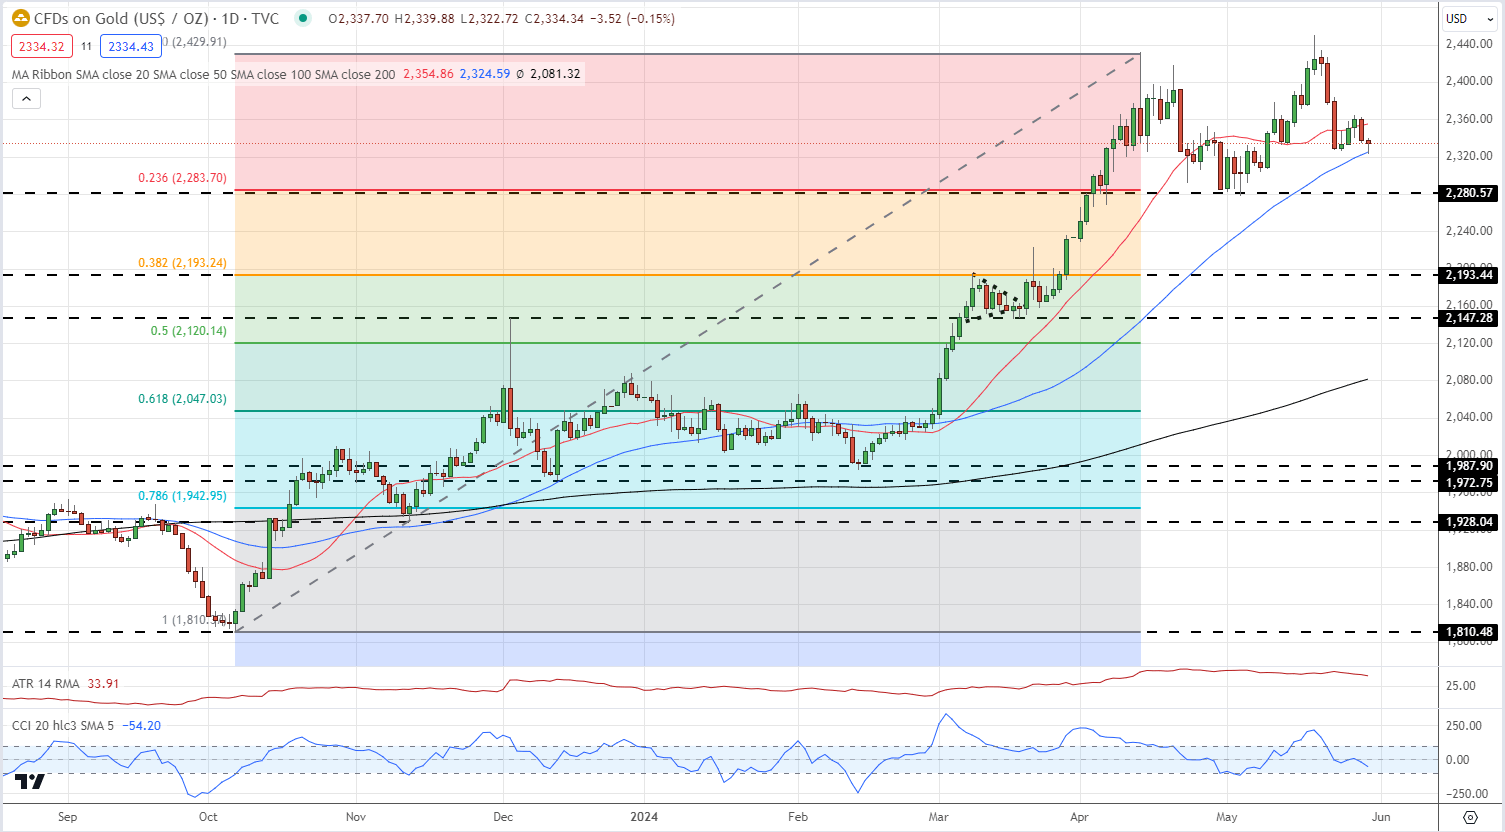
Chart via TradingView
Retail trader data show shows 60.78% of traders are net-long with the ratio of traders long to short at 1.55 to 1.The number of traders net-long is 4.66% lower than yesterday and 18.87% higher than last week, while the number of traders net-short is 0.04% lower than yesterday and 1.85% lower than last week.
We typically take a contrarian view to crowd sentiment, and the fact traders are net-long suggests Gold prices may continue to fall. Positioning is less net-long than yesterday but more net-long from last week. The combination of current sentiment and recent changes gives us a further mixed Gold trading bias.
| Change in | Longs | Shorts | OI |
| Daily | 4% | 5% | 4% |
| Weekly | -4% | 12% | 3% |
What is your view on Gold – bullish or bearish?? You can let us know via the form at the end of this piece or contact the author via Twitter @nickcawley1.


