


HANG SENG, CSI 300 Index- Outlook:
- The Hang Seng Index has reversed course after failing to break above key resistance.
- The CSI 300 index is testing a crucial support.
- What is the outlook and what are the key levels to watch?

China/Hong Kong equities are testing crucial support areas that could define the trend for the next few weeks, possibly months.
In recent weeks, China/Hong Kong equities have shown tentative signs of base building, but have lacked the much-needed follow-through upward momentum. For more discussion on this, see “HK/China Equities Attempt to Build Base on Stimulus Hopes; Hang Seng, CSI 300 Price Setups,” published August 1.
As a result, the Hang Seng Index and the CSI 300 index are now testing the lower end of the recent range amid a faltering economy and a prolonged slowdown in the property market. Tight liquidity conditions have weighed on the real estate sector, dragging down the broader index.
Chinese authorities have pledged to support the fragile post-Covid economy recovery, focusing on boosting domestic demand, confidence and preventing risks. Authorities have also responded with a series of stimulus measures, but those measures haven’t boosted confidence yet.
Hang Seng Index Monthly Chart
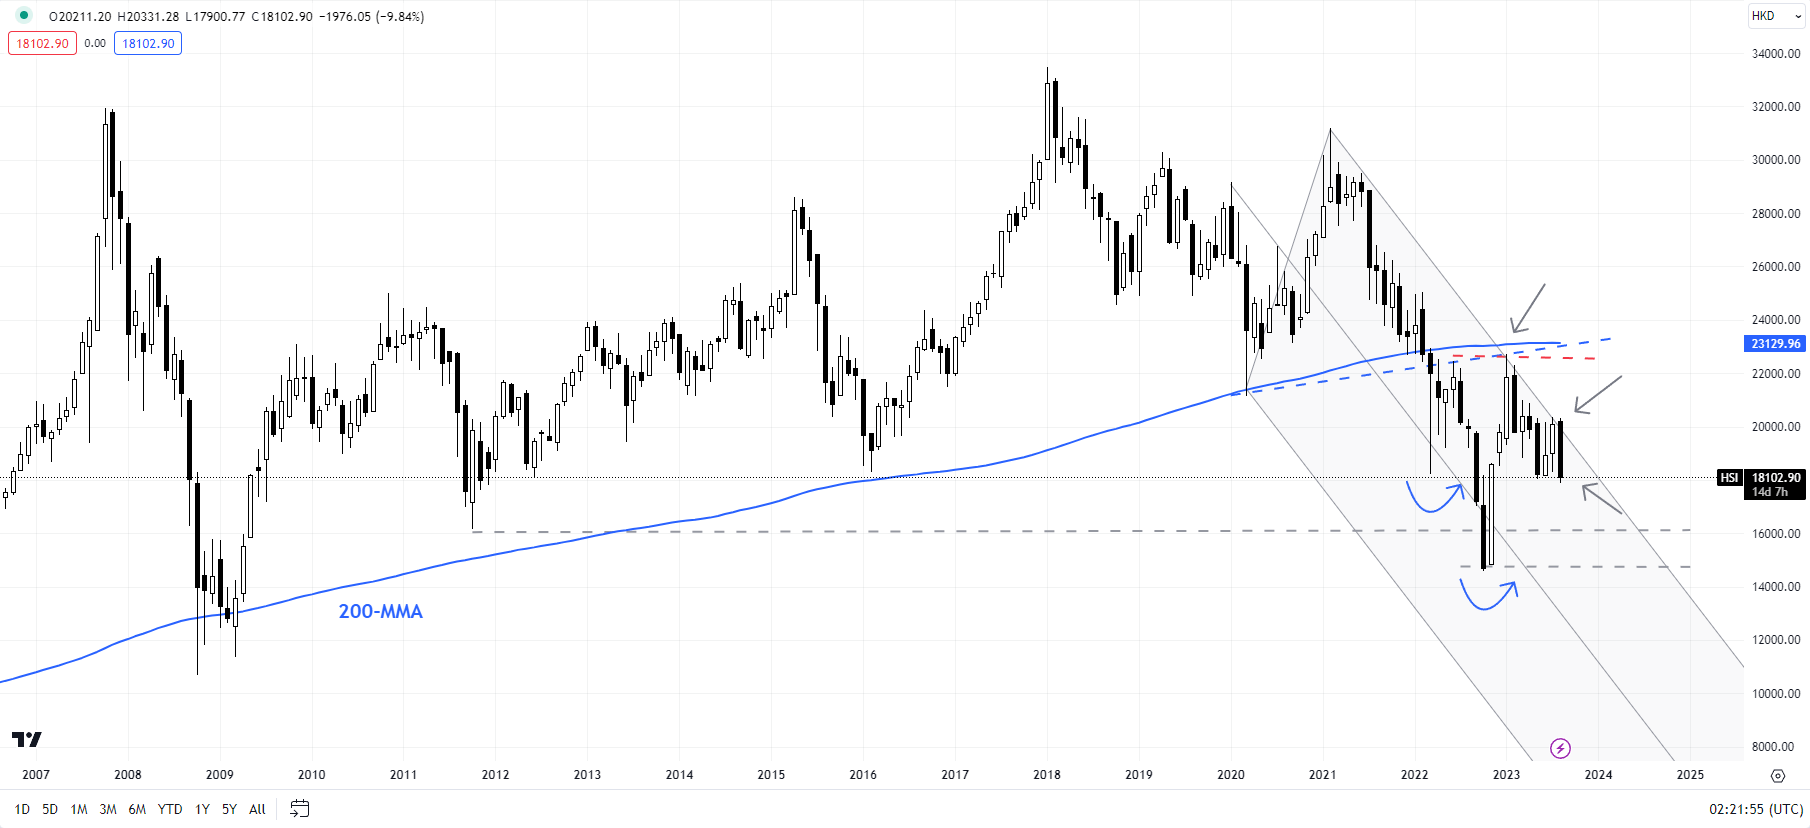
Chart Created Using TradingView
As highlighted in the previous update, attractive valuations compared with some of its peers, generally oversold conditions, and higher risk premia (according to some estimates, pessimism toward China is at extreme levels) argue for a turnaround in Hong Kong/China equities. The catalysts, however, appear to be lacking.
Hang Seng Index Daily Chart
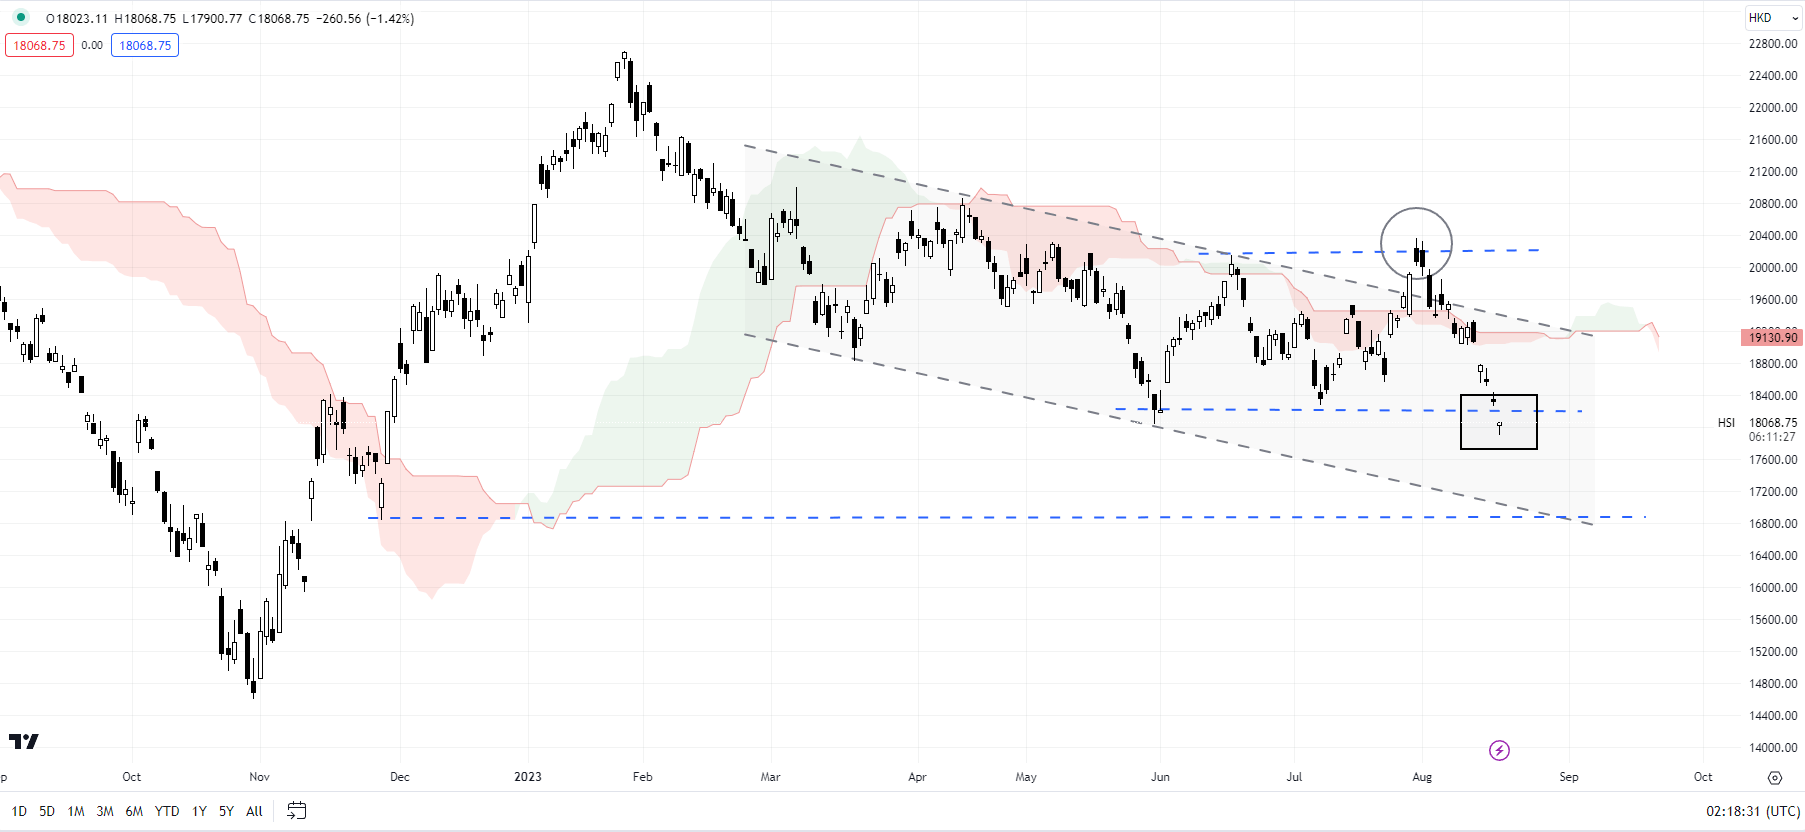
Chart Created Using TradingView
Hang Seng: Now or never moment
A failed attempt to rise past a key ceiling at the mid-June high of 20155 has put the Hang Seng Index (HSI) back within its well-established range since June. As highlighted in the previous update, a break above 20155 is crucial for the base-building view to hold. The index is now testing the lower edge of the range at about 18000. The next support is around the November 2022 low of 16830.
CSI 300 Index Weekly Chart
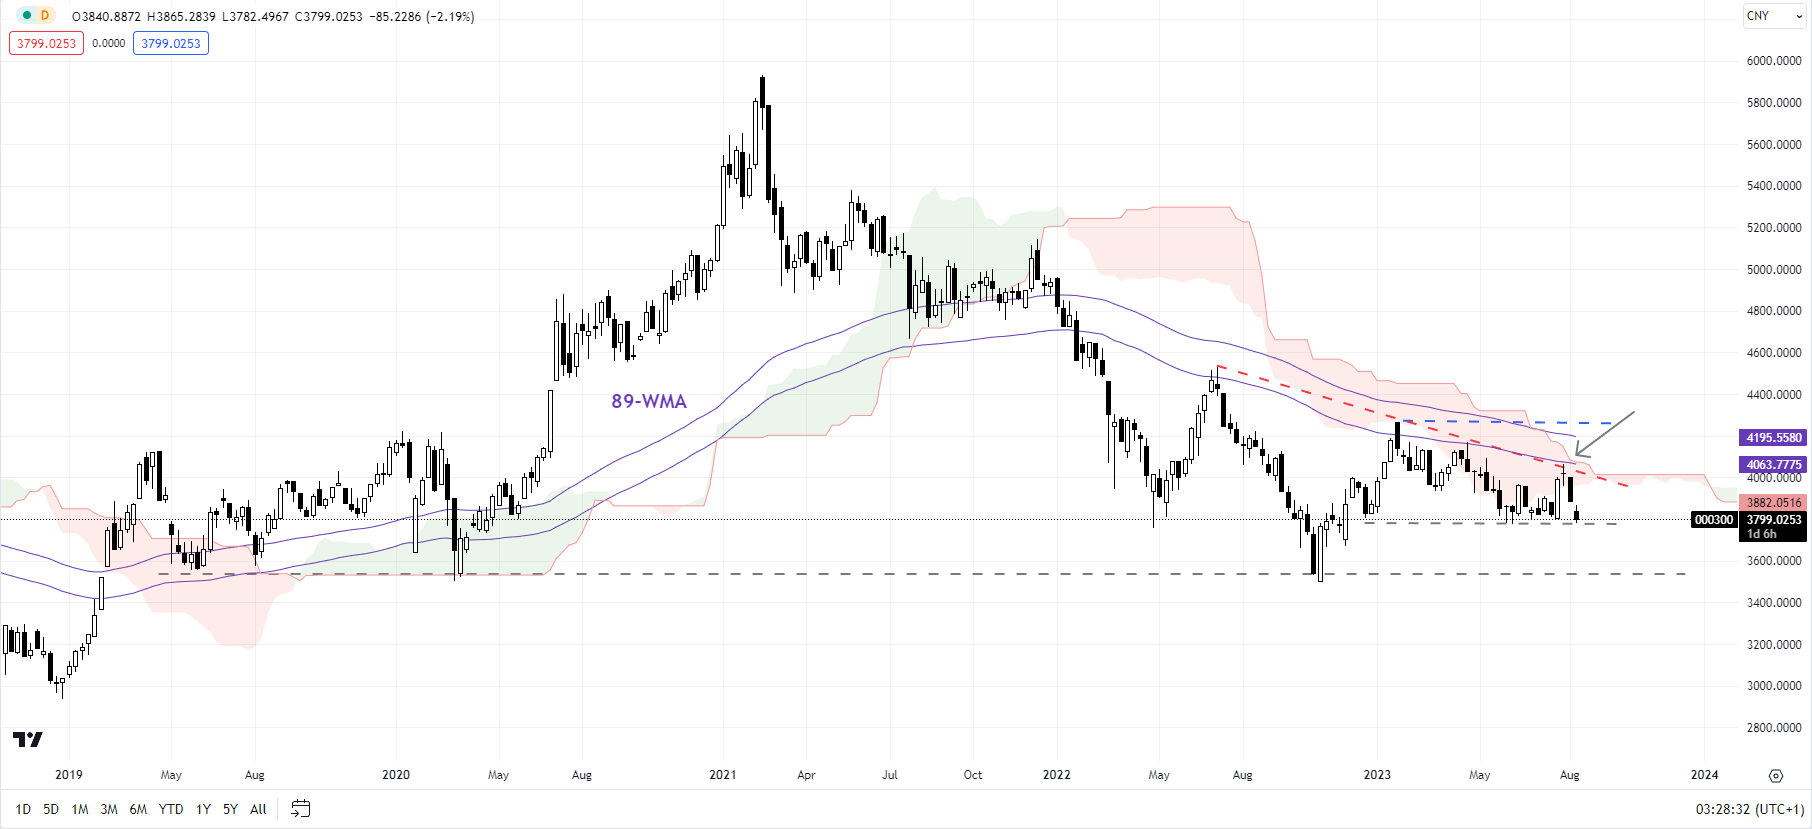
Chart Created Using TradingView
While it would be premature to assume a lower break, a decisive fall below the support would raise the odds that the November 2022-January 2023 rebound is over, shifting the balance of risks toward the downside. On the upside, a crack above 20155 is needed for the immediate bearish risks to fade.
CSI 300 Index Daily Chart
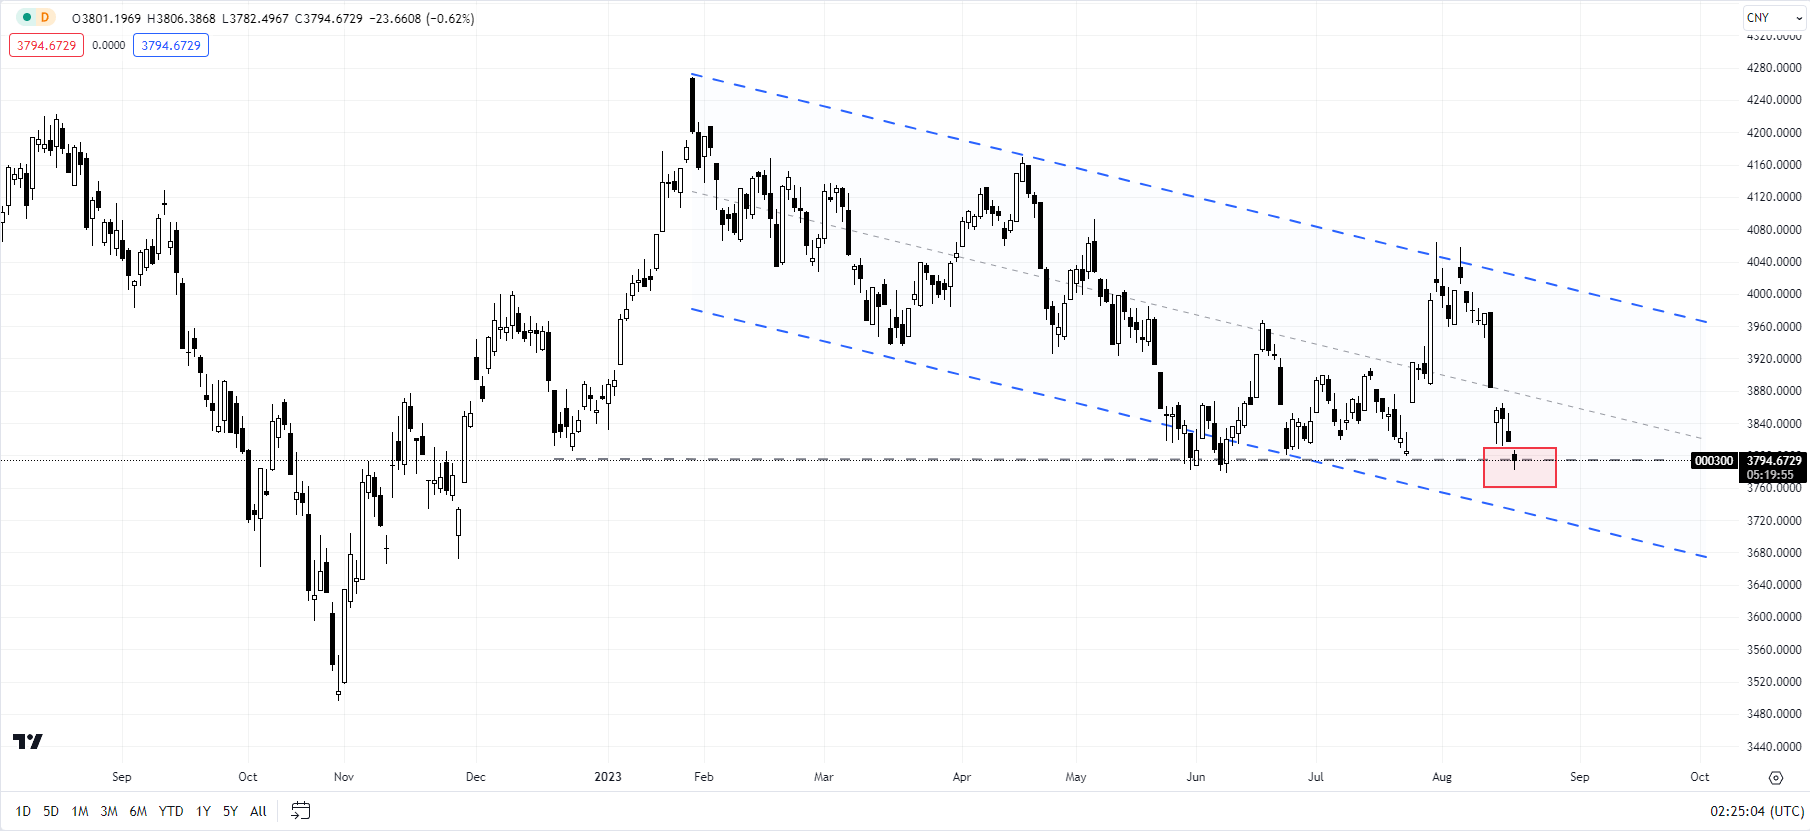
Chart Created Using TradingView
CSI 300: At a crucial support
The CSI 300 index has surrendered all of its gains after a failed attempt to decisively rise above the stiff hurdle at the June high of 3968. As highlighted in the previous update, unless the index surpasses the immediate ceiling at the February high of 4268, the path of least resistance remains sideways to down.
It is now testing crucial support at the June low of 3780. Any break below could pave the way toward 3675 initially, possibly the October low of 3495.

--- Written by Manish Jaradi, Strategist for DailyFX.com
--- Contact and follow Jaradi on Twitter: @JaradiManish


