


US Stocks Weekly Forecast: Bullish
- Hawkish Fed speak attempts to keep market expectations onside
- Bullish S&P 500: Fear gauge at basement levels despite technical signs of an overheating market
- Bullish Nasdaq 100: Prices test the upper bound of the ascending channel without a major retracement. Powell’s testimony appears the biggest risk to bullish continuation
- The analysis in this article makes use of chart patterns and key support and resistance levels. For more information visit our comprehensive education library

Hawkish Fed Speak Attempts to Keep Market Expectations Onside
On Friday, prominent Fed hawks were in full flight reiterating unsatisfactory progress on core measures of inflation and warning of further rate hikes to come. Fed Governor Christopher Waller and Richmond Fed head Thomas Barkin expressed their concern over the lack of progress in widespread price pressures.
The Fed’s Barkin expressed a preference for further tightening if incoming data fails to provide convincing evidence that slowing demand is returning inflation to 2%. In addition, Christopher Waller expressed that he is disturbed that core inflation is not moving and will probably require “some more tightening”. According to the newly updated summary of economic projections, Fed officials anticipate two more 25-bps hikes before reaching peak rates – something the market doesn’t agree with. Markets currently price in around 21 bps of hikes before topping out, or entertaining one more hike, not two. The chart below shows various measures of PCE inflation with Jerome Powell often making reference to his dissatisfaction of PCE core services excluding housing (green line).
PCE Core Services Ex-Housing
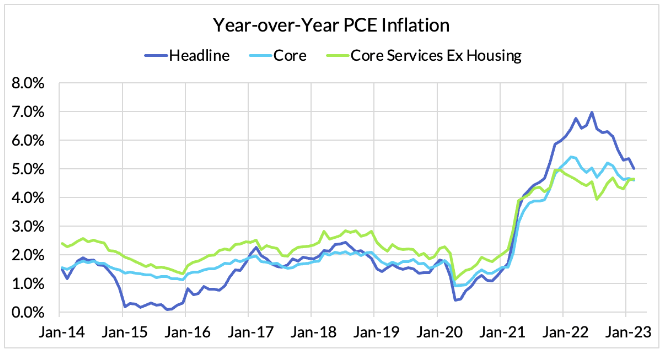
Source: Employ America, prepared by Richard Snow
S&P 500 Weekly Forecast: Bullish
Given the impressive bullish momentum that has taken place, it would be reasonable to assume that a combination of profit taking and caution may determine the direction of travel next week. The RSI on the daily chart has breached overbought territory for some time now and the weekly chart is on the verge of overheating too. Contrarian fear and greed indices remain at extreme levels of greed which have tended to provide turning points in the past.
So why the bullish bias if warning signs appear to be flashing red? The answer, the volatility index (VIX) and lack of high impact US data. The VIX is also known as the ‘fear gauge’ measures implied volatility for S&P 500 index options and tends to pick up during times of fear or massive S&P 500 sell-offs. This is often due to a surge in put options which act as insurance against a falling stock market – something we are not currently seeing. In fact, the VIX flirts with pre-covid levels and appears to be headed lower.
The S&P 500 is on track for a 3% rise this week and appears to be taking the Fed’s warning in its stride. Tech and AI household names continue to drag the entire index along with the zone of resistance around 4550 now very much insight. The zone of confluence combines the August and September high of 4550, the 78.6% Fibonacci retracement of the major 2022 sell-off (4528) and the upper bound of the ascending channel. Support is a long way off current levels, around 4327.50.
S&P 500 (E-Mini Futures) Weekly Chart
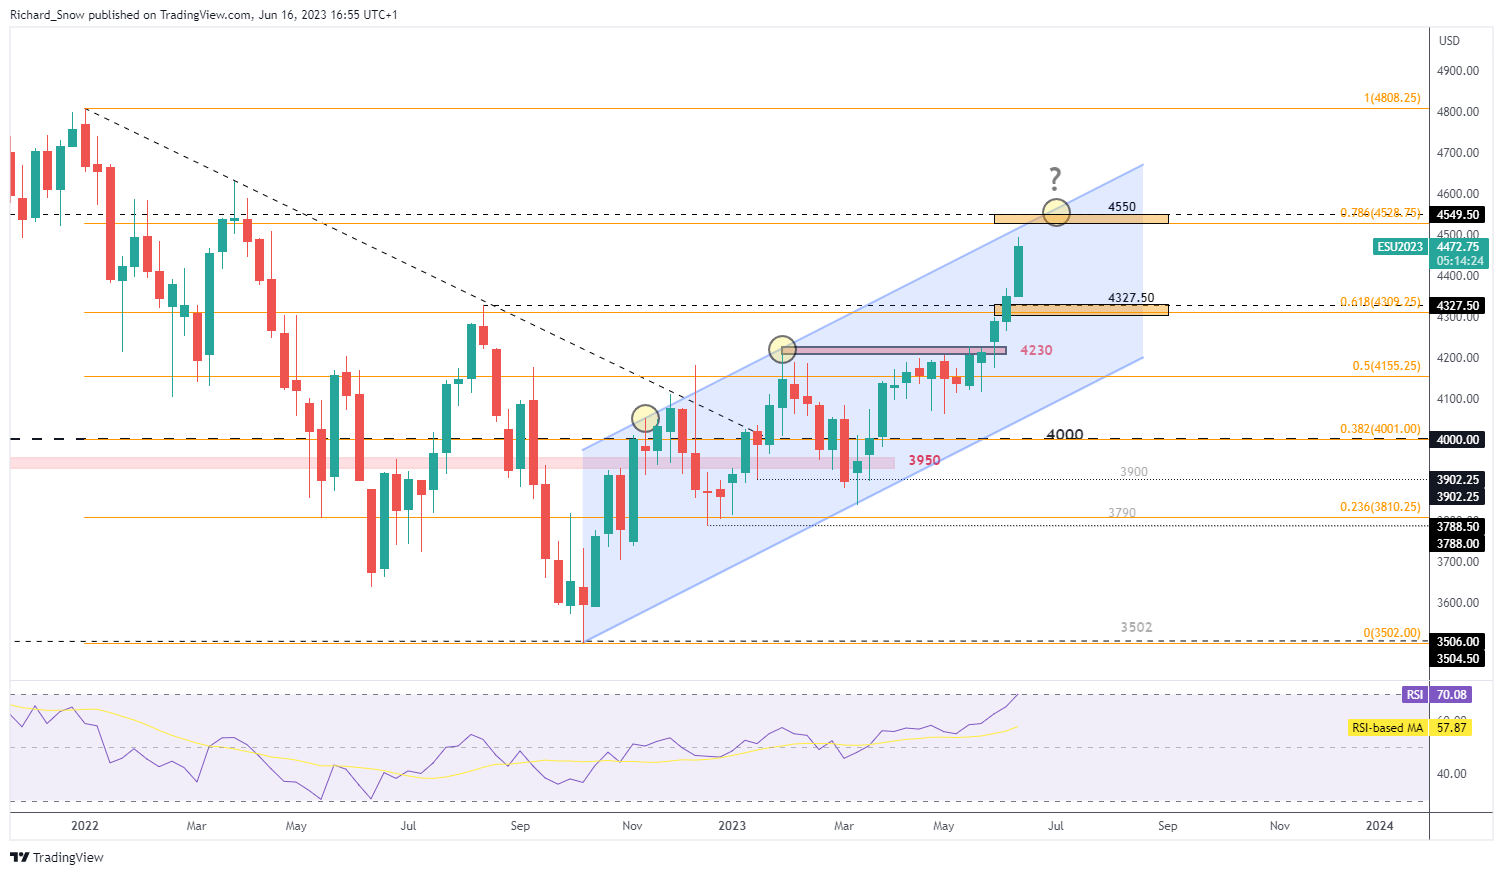
Source: TradingView, prepared by Richard Snow
Nasdaq 100 Weekly Forecast: Bullish
Unsurprisingly, the tech heavy Nasdaq exhibits a similar weekly chart although it is heavily within overbought territory, having recently breached the January and March high of 15,260 and now tests the 78.6% retracement of the major 2022 decline. A bullish continuation would need to do further heavy lifting as the next level of resistance appears at 16,768 – the full retracement of the 2022 major sell-off.
Also worth noting is that price action tagged the upper bound of the ascending channel and eased slightly lower thereafter. Support lies around 1000 points lower than current levels, at 14,367.50.
Nasdaq 100 Futures (NQ1!) Weekly Chart
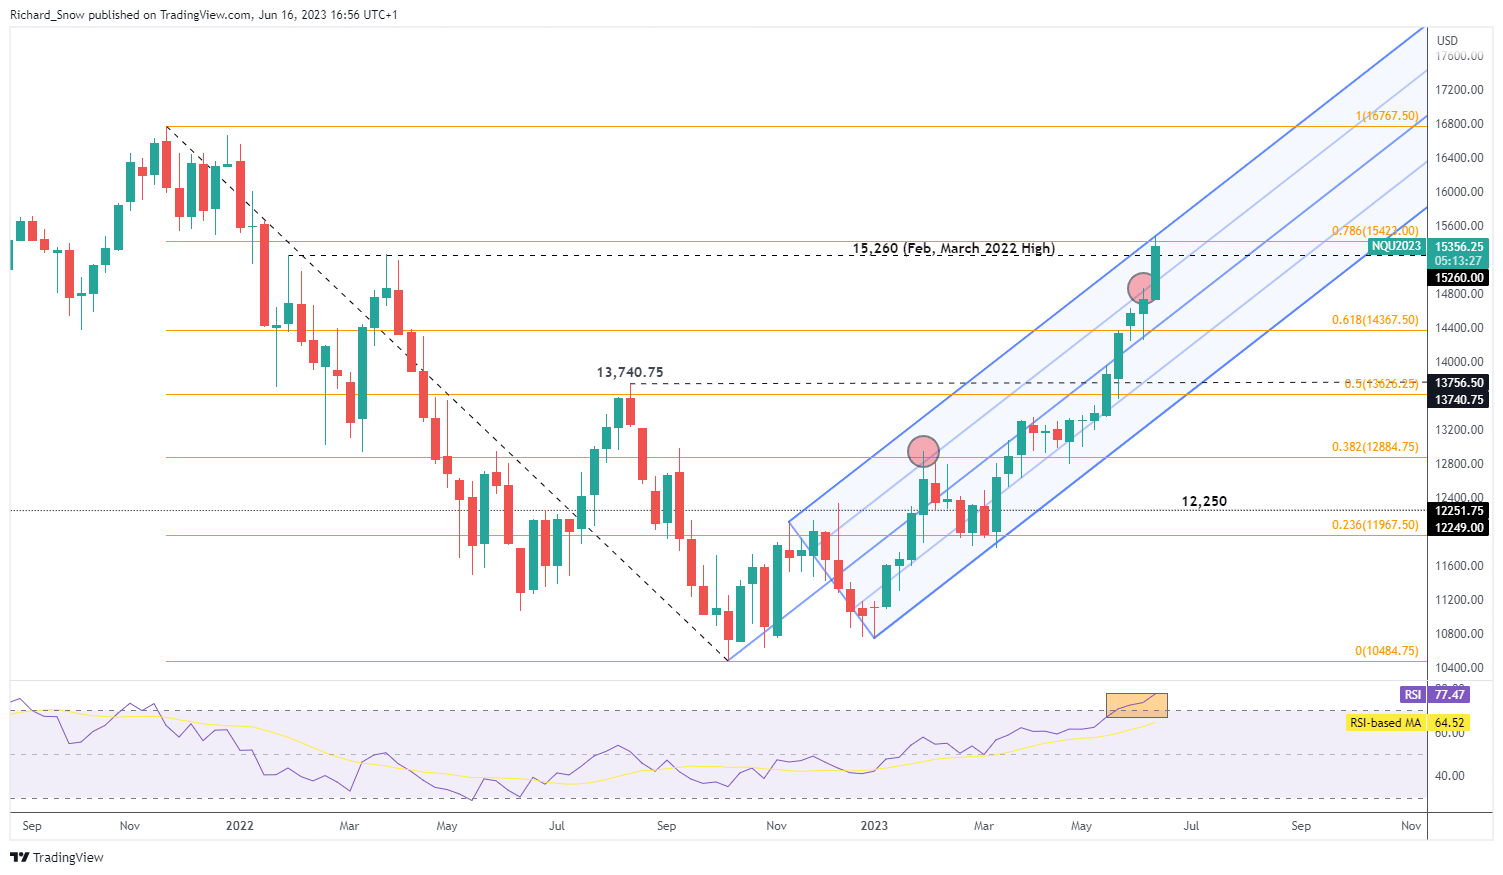
Source: TradingView, prepared by Richard Snow
Jerome Powell’s testimony in front of the Senate Banking Committee appears the only risk event that could see prices drop sharply next week. The Fed and the US Treasury Department have admitted that further “mergers” are likely – referring to troubled regional banks having to be taken over by larger, more rigorously regulated banks. Resurfacing nervousness within the banking sector could see US equities pull back.
--- Written by Richard Snow for DailyFX.com
Contact and follow Richard on Twitter: @RichardSnowFX


