SILVER & GOLD PRICE OUTLOOK:
- Gold prices pushed higher this past week, but silver was largely flat
- Next week, however, both precious metals may exhibit a more synchronized performance, potentially moving in an upward direction together
- The bullish outlook hinges on a dovish repricing of interest rate expectations
Most Read: August Jobs Report: Payrolls Rise by 187K, Setting Gold and USD on Opposite Paths
Gold (XAU/USD) and Silver (XAG/USD) delivered a disparate performance this past week, with the former up around 1.3% and the latter relatively unchanged despite some wild swings during the five-day period, all against a backdrop of U.S. dollar indecision in the FX market, which saw the DXY index initially declined before rebounding to close largely around the flatline.
The divergence within the precious metal’s complex, however, may be a temporary phenomenon, hinting at a potential convergence in their price movements in the coming days, possibly in an upward direction. That said, one possible catalyst that could have bullish implications for the space is the repricing of the Federal Reserve’s monetary policy outlook.
Over the past few days, the likelihood of further FOMC tightening in 2023 has decreased, primarily due to soft U.S. economic indicators, such as August consumer confidence and July job vacancies (JOLTS). The most recent nonfarm payrolls survey has also contributed to this swing in sentiment, not by revealing weakness, but by indicating a better balance between supply and demand for workers.
Decode the secrets of successful trading. Download the "How to Trade Gold" guide to unlock key insights and strategies!

With the Fed embracing a data-dependent approach and pledging to proceed carefully in terms of future moves, there is the potential for interest rate expectations to tilt downward in the near term, particularly if incoming information start to show evidence of a downturn brewing on the horizon. This scenario should weigh on yields and U.S. dollar, creating a more constructive backdrop for gold and silver.
A key report that may offer important clues about the evolving outlook this coming week is the ISM services activity index. This indicator is forecast to have slowed to 52.5 in August from 52.7 previously, but a deeper retrenchment should not be ruled out given the softness in some regional PMIs. In any case, the weaker the results, the better for gold and silver.
US ECONOMIC DATA
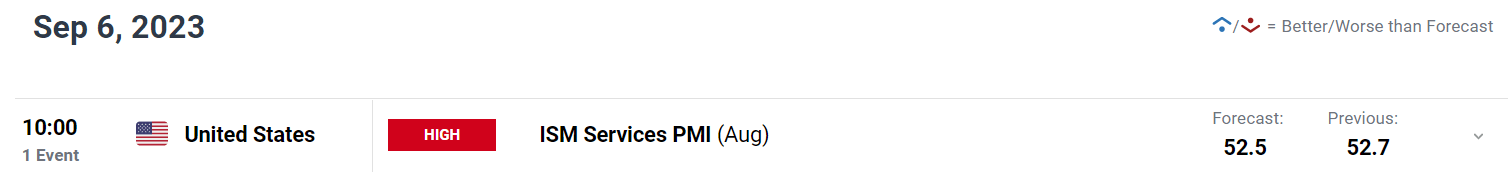
Source: DailyFX Economic Calendar
Elevate your trading game by downloading the third-quarter fundamental and technical outlook for gold prices.

GOLD TECHNICAL ANALYSIS
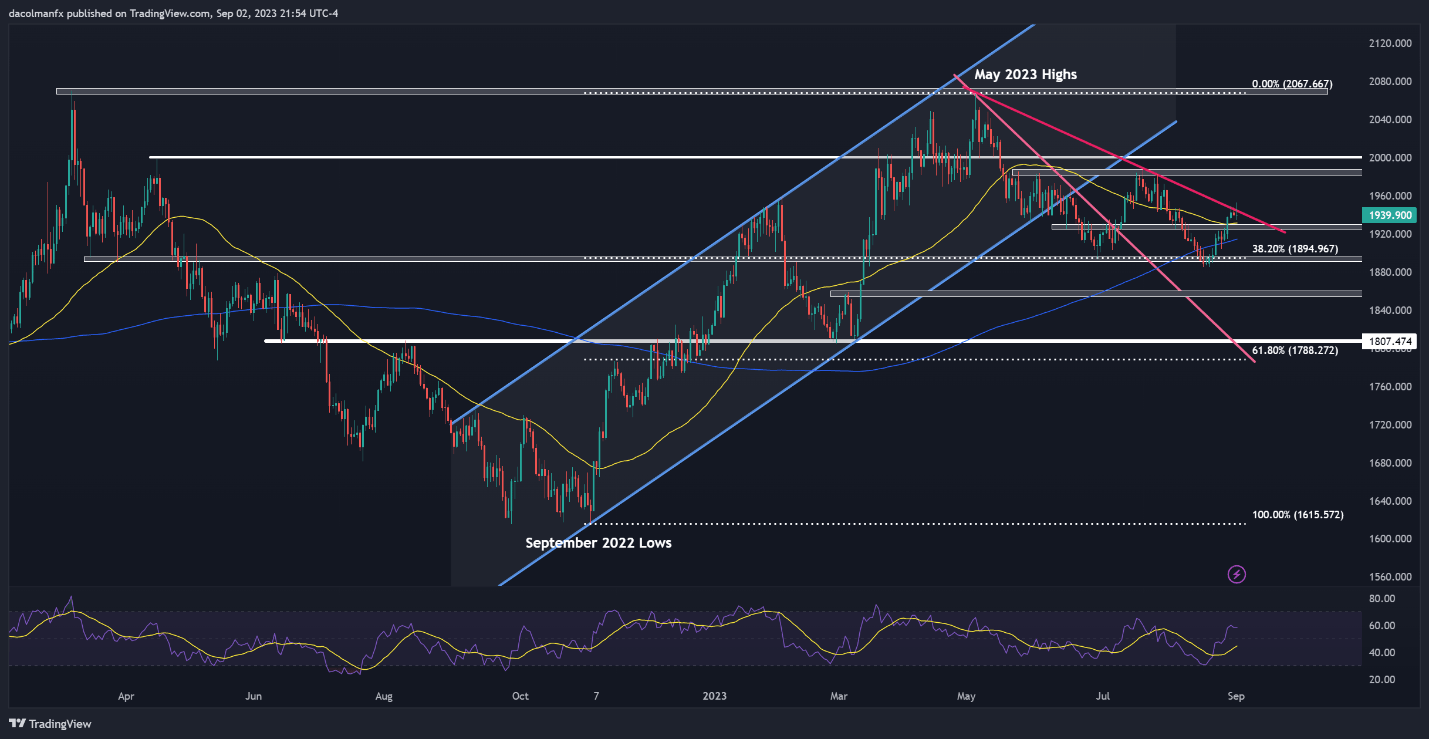
Gold climbed towards the latter part of August, recapturing both its 200-day and 50-day simple moving averages. However, as the month drew to a close, XAU/USD’s upside impetus waned, coinciding with prices challenging trendline resistance a touch below $1,950.
While the nascent rebound remains viable, a decisive move above $1,950 is needed to rekindle upward pressure. Successfully piloting above this technical barrier could attract new buyers into the market, creating a conducive environment for a rally toward $1,985, followed by $2,000.
Conversely, if XAU/USD gets rejected from current levels and begin to head lower, initial support is visible at $1,930, and $1,915 thereafter, with the latter level corresponding to the 200-day SMA. Further down the line, the next critical floor sits at $1,895 (38.2% Fib retracement of Sept 2022/May 2023 rally).
To understand how market positioning may affect gold prices, download the sentiment guide and get an edge in your trading.
| Change in | Longs | Shorts | OI |
| Daily | 4% | 4% | 4% |
| Weekly | -4% | 12% | 3% |
GOLD PRICE TECHNICAL CHART