Article by IG Senior Market Analyst Axel Rudolph
FTSE 100, CAC 40, Nasdaq 100 Charts and Analysis
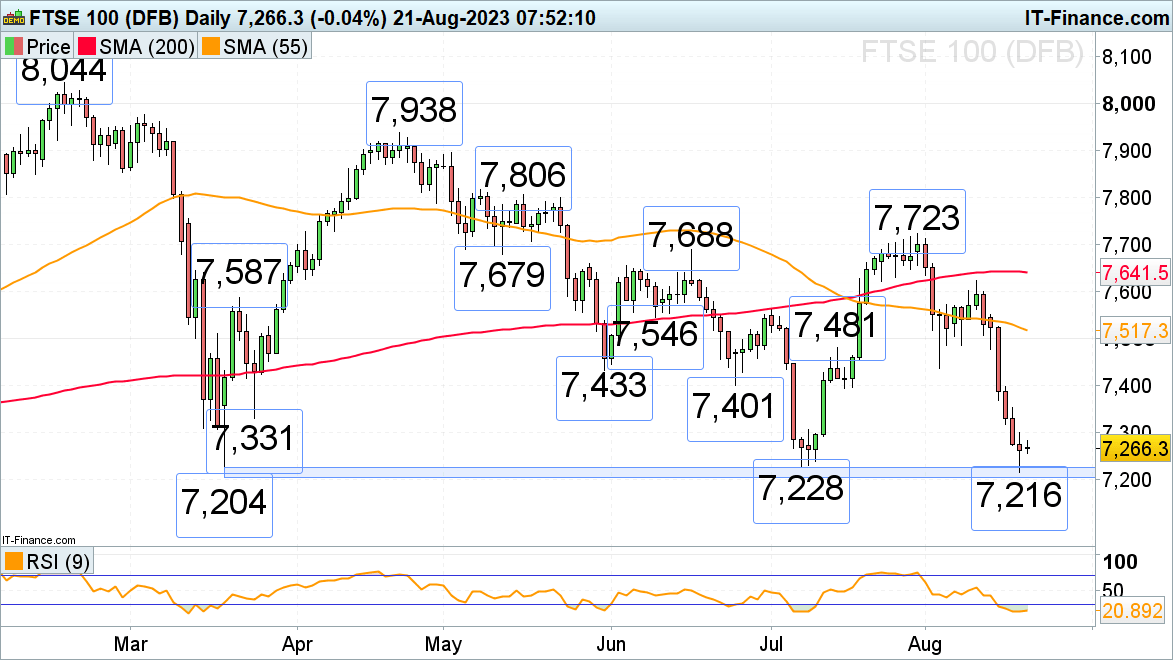
FTSE 100 stabilises at support
Following six consecutive days of falling prices, the FTSE 100 managed to find support between its March and July lows at 7,216 last week and is little changed on Monday morning as the economic calendar is empty.
Asian stock indices also didn’t provide much direction despite the People’s Bank of China (PBOC) having eased its monetary policy on its 1-year loan prime rate to a record low of 3.45%. The 10 basis-point (bp) cut was less than the 15 bp cut traders had hoped for and together with the unexpectedly unchanged 5-year rate at 4.20% painted a mixed picture for stocks.The UK blue-chip index is expected to trade in a low volatility trading range above its 7,228 to 7,204 major support zone on Monday.
Minor resistance can be found at the 24 March low at 7,331 and more significant resistance between the May and June lows at 7,401 to 7,433.
FTSE 100 Daily Chart
Learn How to Use IG Client Sentiment When Trading the FTSE
| Change in | Longs | Shorts | OI |
| Daily | 14% | -16% | -4% |
| Weekly | -1% | 0% | 0% |
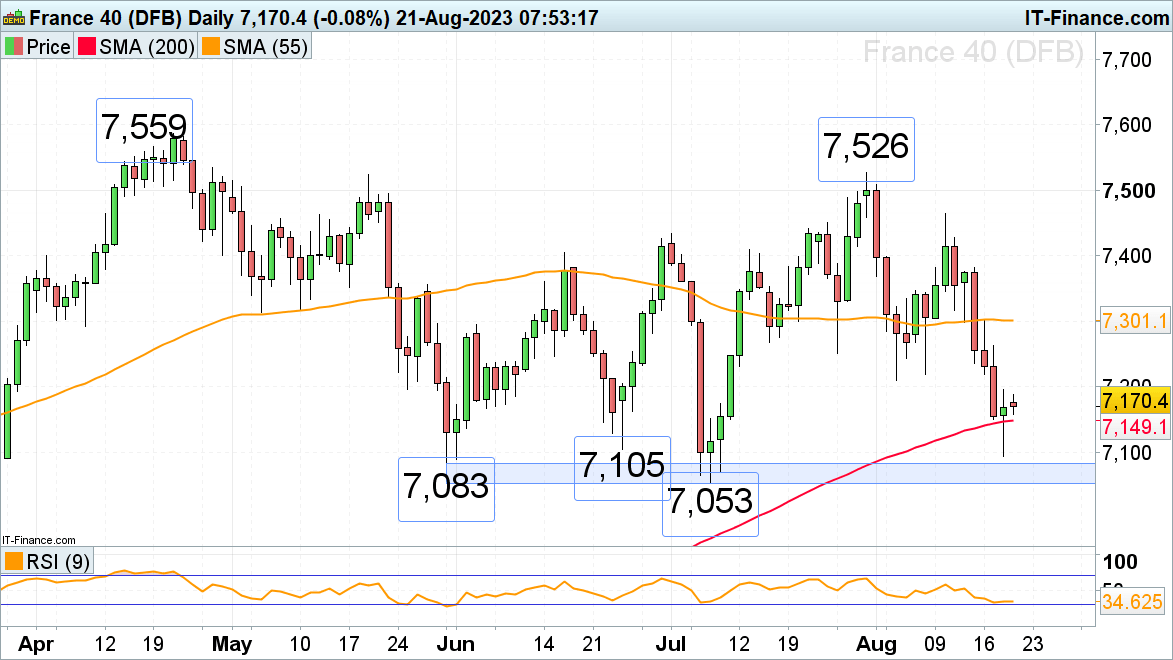
CAC 40 trades back around the 200-day simple moving average
Last week the rout in the French CAC 40 index nearly reached the May to July lows at 7,083 to 7,053 before rising back above its 200-day simple moving average (SMA) at 7,149 on China growth concerns, US yields rising to 2008 levels and as China's Evergrande filed for bankruptcy protection in New York. On Monday further sideways trading around the 200-day SMA remains at hand with the June low at 7,105 offering minor support.
Resistance can be found between the early August lows at 7,210 to 7,218.
CAC 40 Daily Chart

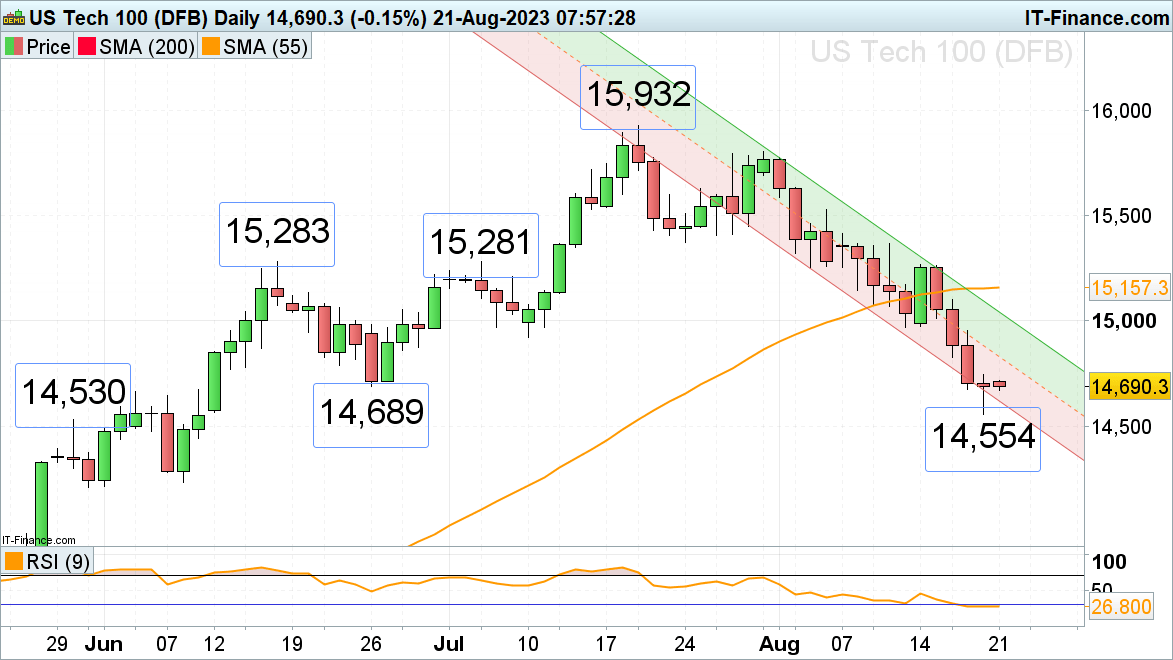
Nasdaq 100 stabilises above last week’s two-month low
The Nasdaq 100’s summer decline amid rising longer-dated US yields last week took it to a fresh two-month low at 14,554 before leveling out ahead of this week’s Jackson Hole symposium which will take place from Thursday until Saturday.
Last week’s trough at 14,554 and the 14,530 late May high continue to offer support while minor resistance can be spotted at the July low at 14,920.
Nasdaq 100 Daily Chart