
S&P 500 Analysis
- S&P 500 sector performance thins out – major advances seen in handful of sectors
- Popular measure of market breadth has dropped slightly but raises no alarm bells
- S&P 500 to retest last week’s Psychological Barrier
- The analysis in this article makes use of chart patterns and key support and resistance levels. For more information visit our comprehensive education library

As we near the end of the quarter it is time to assess how US stocks have fared. AI stocks and chipmakers continue to lead the pack but some of the Magnificent Seven stocks appear to be experiencing a slowdown in performance, on track for low single digit gains for the second quarter. One thing to keep in mind is the PCE data out on Friday as a lower print there may provide one last push higher for the index, particularly when you recall that CPI data appears to be back on track after a period of stubborn inflationary pressures. Notable standouts for the quarter include Nvidia, but more surprisingly Apple made an impressive recovery which may get paired back after news of a possible breach of EU antitrust regulations have surfaced after previous run-ins with the oversight bod
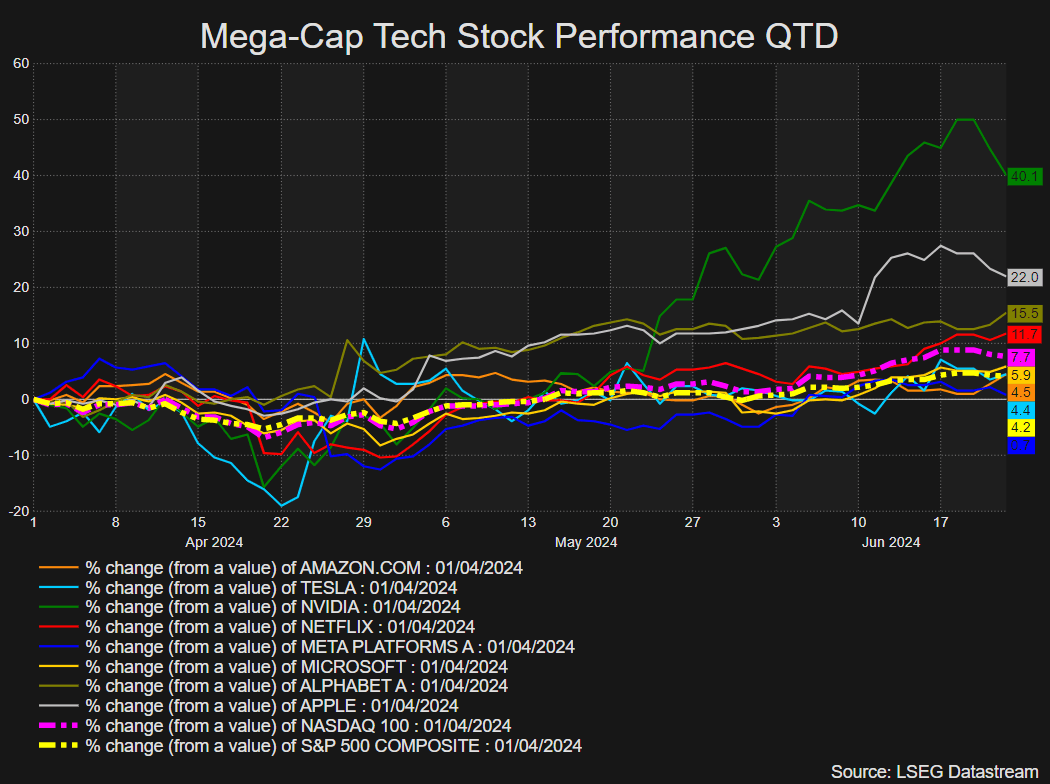
Source: Refinitiv, prepared by Richard Snow
S&P 500 Sector Performance thins out – Major Advances seen in Handful of Sectors
Taking a look at the sectoral breakdown, the rally is now very much focused in three sectors: information technology, communication services and utilities. Other sectors like consumer discretionary and health care have managed low single-digit increases, while industrials, materials and the energy sector have really struggled in Q2. This is in stark contrast to what was experienced in Q1 when all but the real estate sector advanced.
Q1 and Q2 S&P 500 Sector Performance has Thinned out
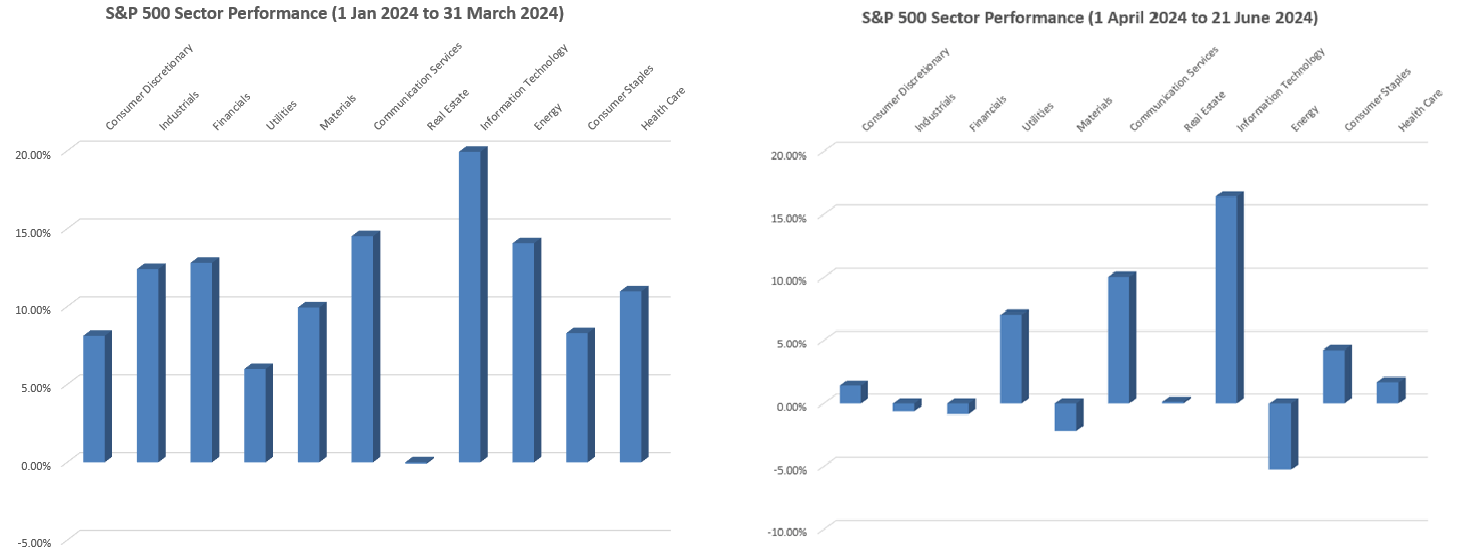
Source: LSEG, Refinitiv Workspace, prepared by Richard Snow
Despite the drop off in sectoral inclusion, market breadth is still holding up. Admittedly it has fallen, with the percentage of S&P 500 stocks trading above their respective 200-day simple moving averages dropping from 80% at the start of the year to 71.17% as of Friday. While lower, the reading does not provide a cause for concern, especially when the top five stocks now make up more than 25% of the entire index. Outperformance by these select few stocks can pull the rest of the index higher still.
A Measure of Market Breadth (% of S&P 500 stocks trading above their 200 DMAs)
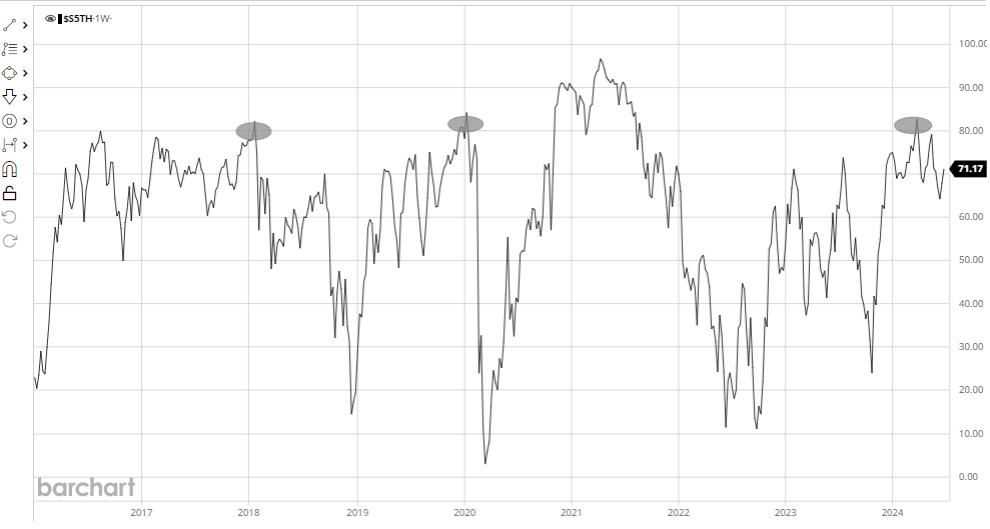
Source: Barchart, prepared by Richard Snow
S&P 500 to Retest Last Week’s Psychological Barrier
The S&P 500 respected the 5,500 mark last week, simultaneously printing a new all-time high. On Monday, the index trades up at the end of the London session, appearing on track for a retest of last week’s line in the sand.
The final US GDP print for Q1 and US PCE data on Friday could both have an impact on the market. US GDP moderating is actually seen as a positive as long as the data does not capitulate. Weaker growth advances the narrative that restrictive policy is hampering the economy necessitating a lowering of interest rates provided inflation is deemed to be under control. PCE inflation data on Friday is the big one this week and could send the index even higher if PCE data drops encouragingly, confirming the recent drop in CPI data. The next big consideration for US stocks will be the quarterly earnings reports for the second quarter.
The overbought status of the market via the RSI indicator suggests bulls may look for a consolidation or minor pullback before contemplating another advance but a lot depends on the data at the end of the week. Support appears at 5,260.
Daily S&P 500 Chart
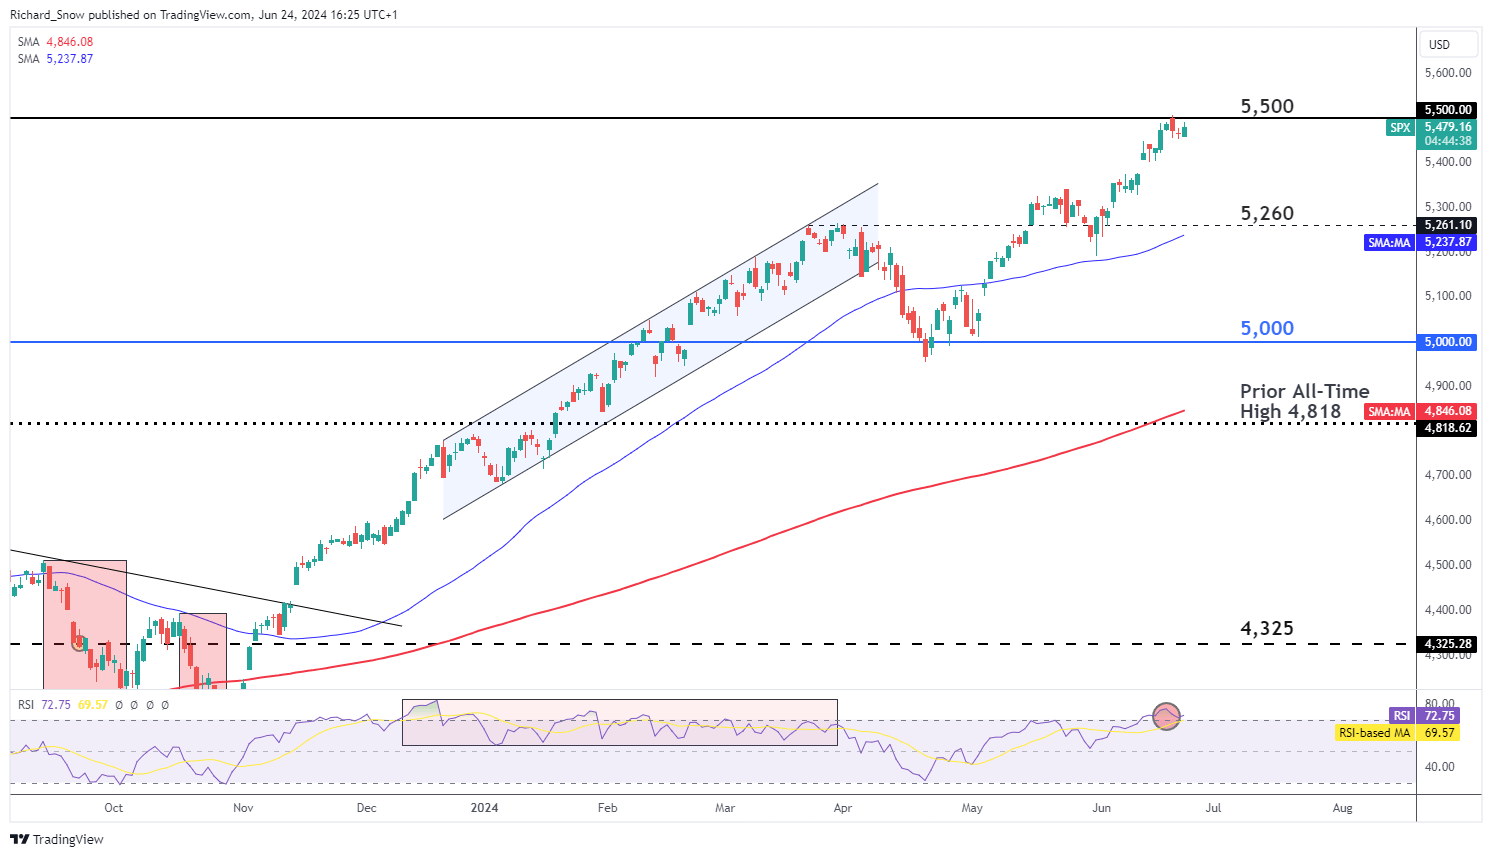
Source: TradingView, prepared by Richard Snow
| Change in | Longs | Shorts | OI |
| Daily | -2% | 1% | 0% |
| Weekly | 10% | -1% | 2% |
--- Written by Richard Snow for DailyFX.com
Contact and follow Richard on Twitter: @RichardSnowFX