

S&P 500, SPX, NASDAQ 100, NDX, DJIA - Price Setups:
- The S&P 500 index and the Nasdaq 100 index continue to trade below their key resistance zones.
- The Dow Jones Industrial Average is holding gains post the bullish breakout in July.
- What are the outlook and the key levels to watch in the three US indices?

S&P 500: 4325 is key support
While there are no signs of reversal of the uptrend that began earlier this year, signs of fatigue have emerged in recent weeks, as pointed out in recent updates. See “US Indices Hit a Roadblock After Solid Services Print: S&P 500, Nasdaq,” published September 7; “US Indices Rally Beginning to Crack? S&P 500, Nasdaq Price Setups,” published August 3; “S&P 500, Nasdaq 100 Forecast: Overly Optimistic Sentiment Poses a Minor Setback Risk,” published July 23.
On intraday charts, the index in August moved under the Ichimoku cloud cover on the 240-minute charts for the first time since the rally began in early 2023. The subsequent rally has stalled at cloud cover. Taken together, on its own, this doesn’t necessarily mean that the uptrend is reversing – that is, it would well be a consolidation/pause within the uptrend.
S&P 500 Daily Chart
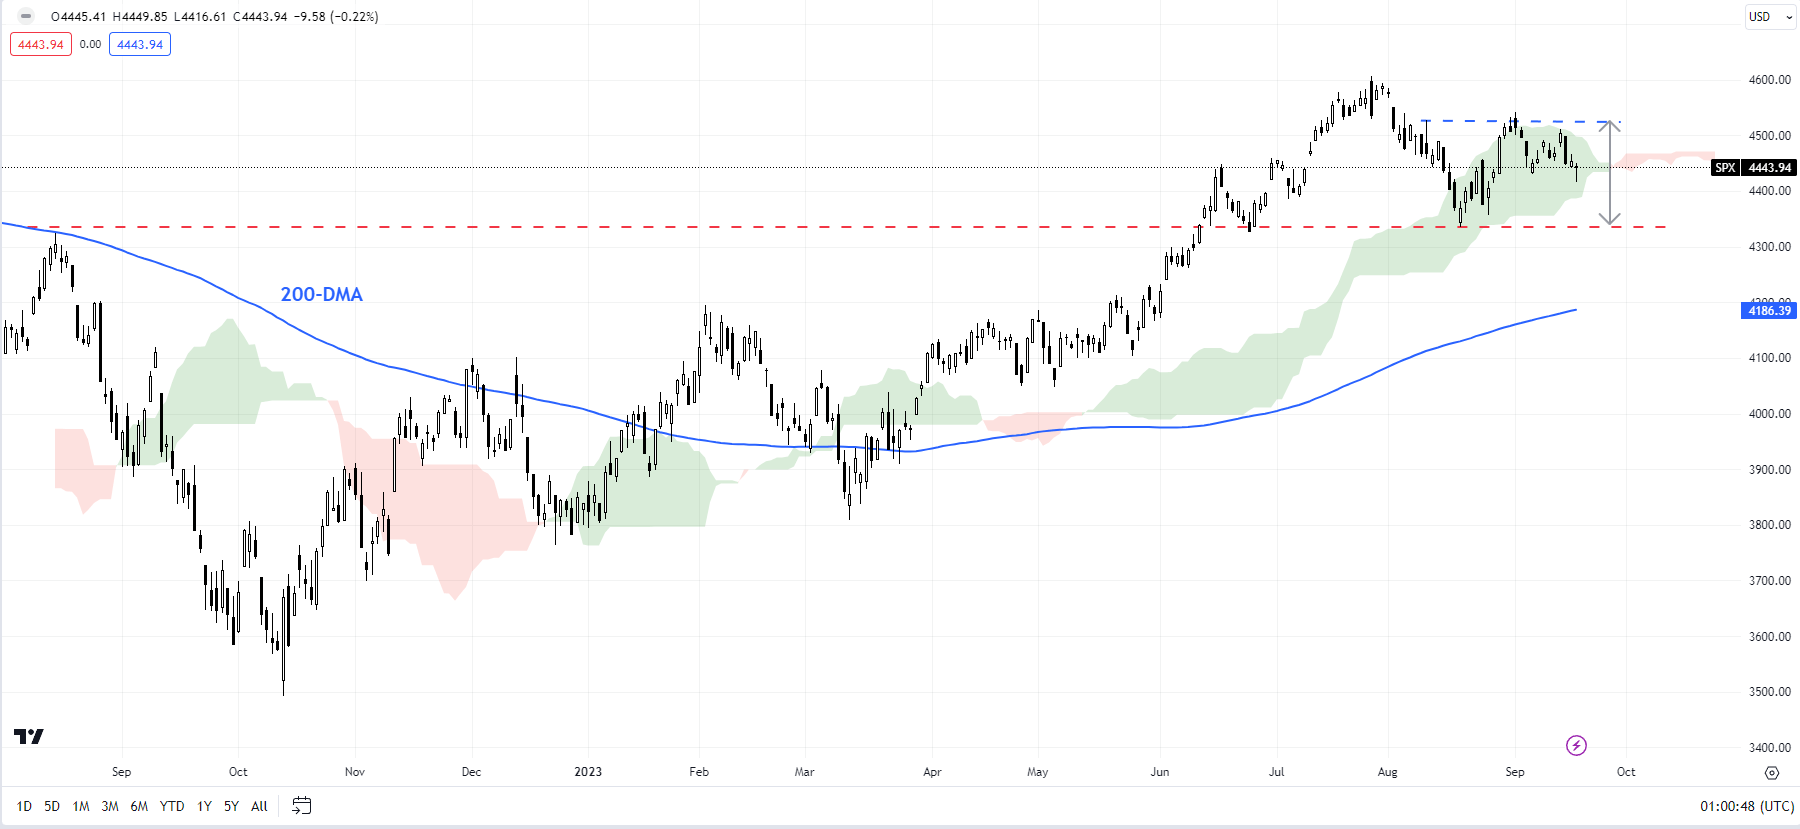
Chart Created by Manish Jaradi Using TradingView.
However, any break below crucial converged support on the 200-period moving average, coinciding with the June low of 4325 would confirm that the multi-week upward pressure had faded. Such a break could open the door toward the 200-day moving average (at about 4200). On the upside, the index needs to crack above 4550 for the downside risks to dissipate. Stronger resistance is at the March 2022 high of 4637.
S&P 500 240-Minute Chart

Chart Created by Manish Jaradi Using TradingView

Nasdaq 100: Upward momentum has slowed recently
While the upward momentum in the Nasdaq 100 index may have slowed, the Moving Average Convergence Divergence indicator on the weekly charts suggests the uptrend has not ended – the MACD indicator continues to hover in positive territory suggesting the interim trend is up. Only a break below the August low of 14560 would pose a risk to the uptrend. Until then, the path of least resistance remains sideways to up.
Nasdaq 100 Weekly Chart
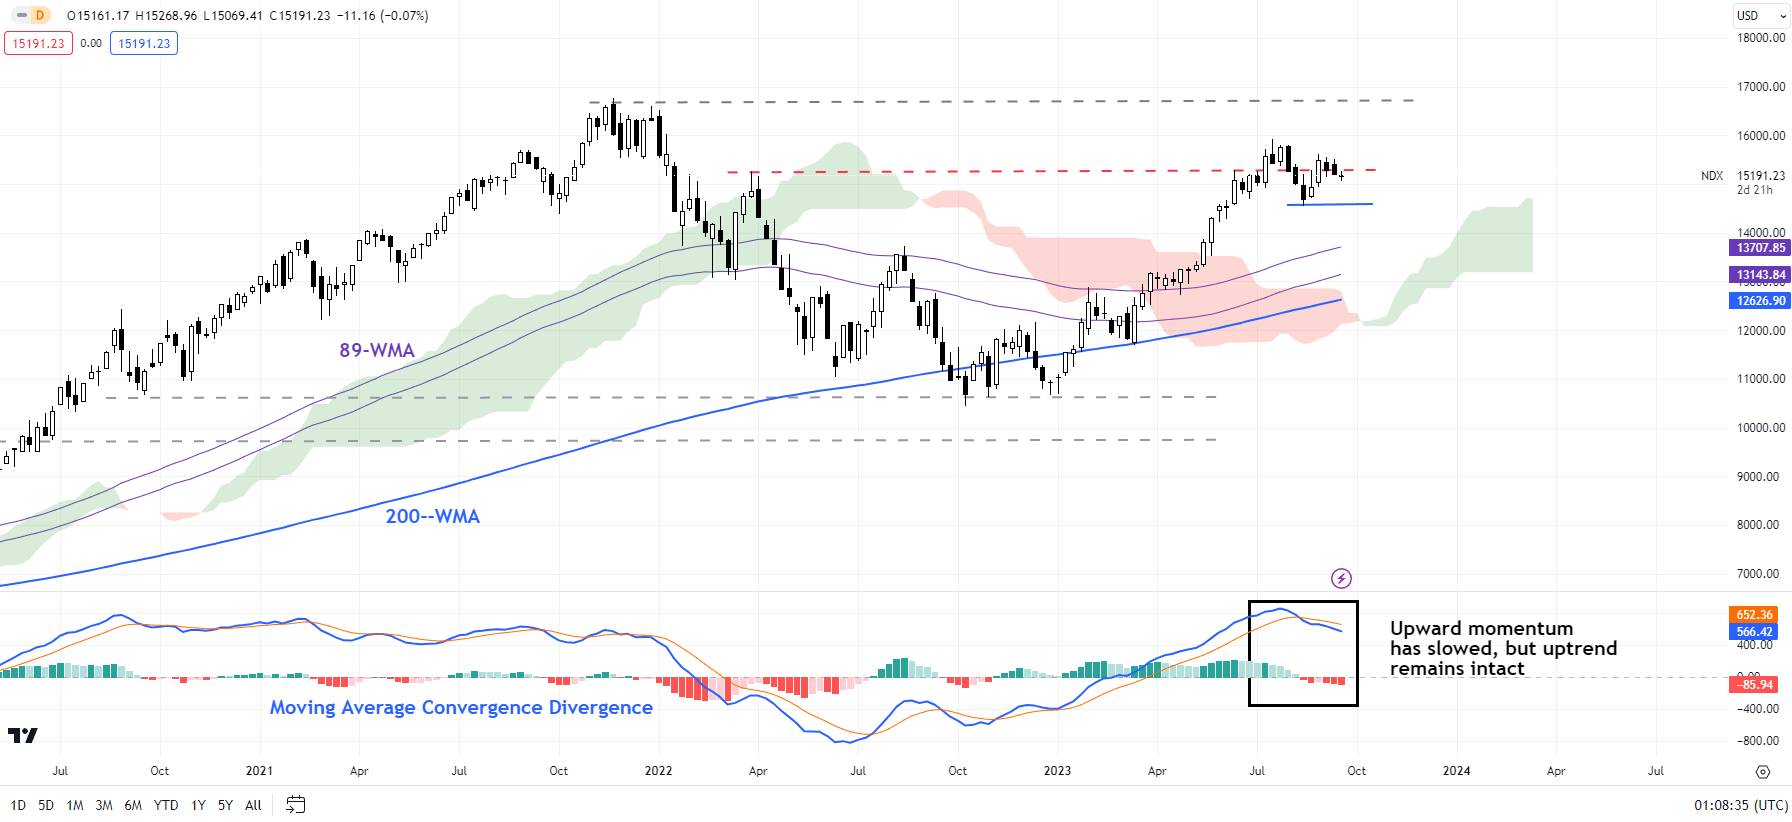
Chart Created by Manish Jaradi Using TradingView
Zooming out, and looking at the bigger picture, as highlighted in arecent update, the momentum on the monthly charts has been feeble compared with the huge rally since late 2022, raising the risk of a gradual weakening, similar to the gradual drift lower in gold since May. For more discussion, see “Is Nasdaq Following Gold’s Footsteps? NDX, XAU/USD Price Setups,” published August 14.
Dow Jones Industrial Average Weekly Chart
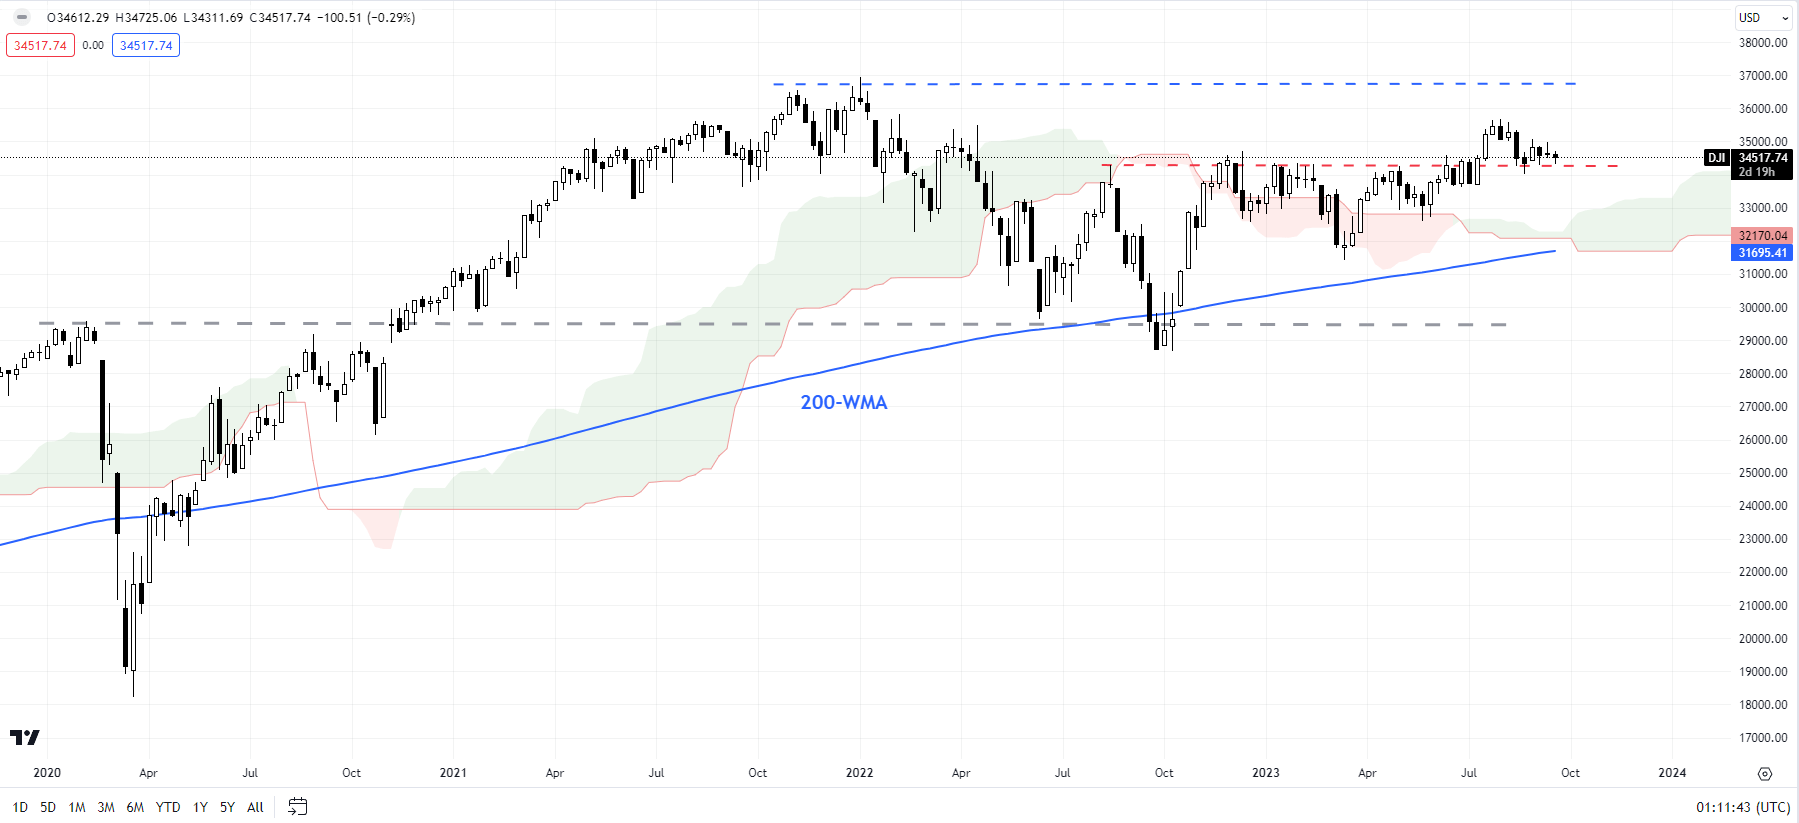
Chart Created by Manish Jaradi Using TradingView
Dow Jones Industrial Average (DJIA): Holding the bullish break
Gains in DJIA have stalled after the bullish break in July above a vital hurdle on a horizontal trendline since 2022. While the breakout confirmed that the downward pressure since 2022 has eased somewhat, it may not be a sign that the index has turned bullish unambiguously. That is, the index needs to break above the early-2022 high of 36950 for the outlook to turn bullish. Until then, the index could remain in a broad range with an upward bias.