
USD/NOK

USD/NOK
 43m
43m
Last updated:
Apr 26, 2024
| Low | |
| High |
Average True Range
Total Intraday Range (% of ATR)
Note: Low and High figures are for the trading day.
The US Dollar / Krone is the most popular pair to trade the Norwegian currency. The price of the Krone is influenced by changes in interest rates and oil prices. The pair saw a lot of volatility between 2002 and 2008 because of the changes in oil prices and the global financial crisis. Norway's economy largely benefits from trade, and a lot of that trade is done with the UK and the Euro-zone. Therefore, the Krone is significantly affected by changes in those economies.
Advertisement
News & Analysis
Euro Gains as the US Dollar Frets ahead of the Fed after Benign CPI. Higher EUR/USD?
2023-06-14 06:00:00

Crude Oil Price Punished Ahead of Fed on Recession Fears. Will WTI Push Lower?
2023-05-03 05:00:00

Swedish Krona Holds the High Ground as US Return from Holidays. Lower EUR/SEK?
2023-02-21 04:30:00
Swedish Krona Bolts Higher, Norwegian Krone Follows. Where to for EUR/SEK and EUR/NOK?
2023-02-10 02:00:00
US Dollar Slips as Markets Weigh Fed Perspectives in Thin Trade. Lower USD?
2023-01-23 06:00:00
Euro Continues to Surge as the US Dollar Wilts Post US CPI. Higher EUR/USD?
2023-01-13 06:00:00
US Dollar Sails South as Powell Puts the Fed Case Forward. How Low Can USD Go?
2022-12-01 01:30:00
Real Time News

Apr 26, 2024
Follow
Discover the key dates of the Economic Calendar here: https://t.co/NaxhOFnF2Y https://t.co/KYX4yvSWUC


Apr 26, 2024
Follow
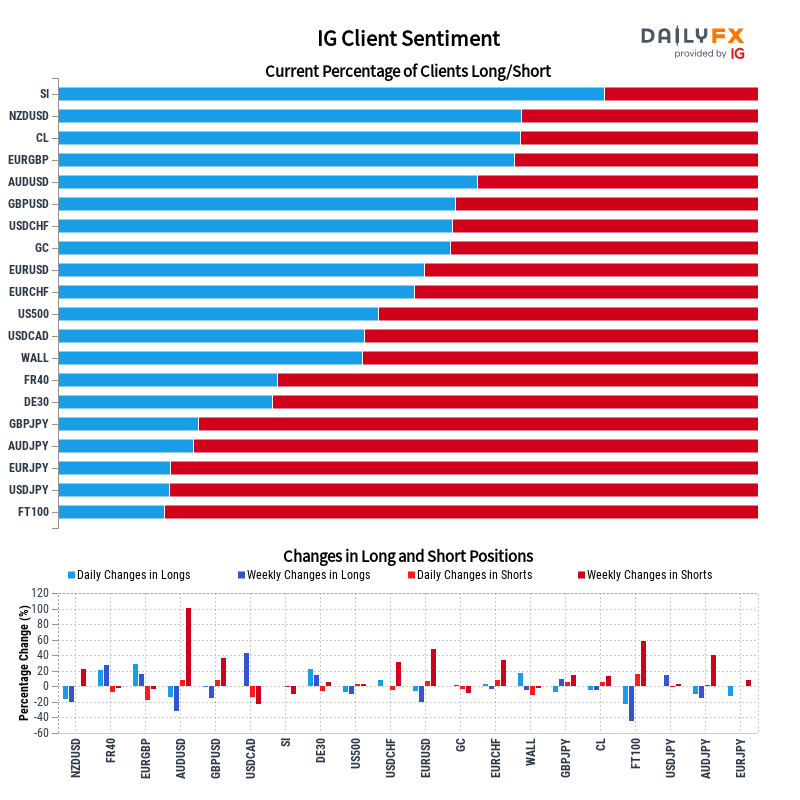
IG Client Sentiment Update: Our data shows the vast majority of traders in Silver are long at 78.04%, while traders in FTSE 100 are at opposite extremes with 84.85%.
See the summary chart below and full details and charts on DailyFX: https://t.co/QeYdESR2tp https://t.co/UFrQthzxPM
Apr 26, 2024
Follow
Heads Up:🇨🇭 SNB Jordan Speech due at 08:00 GMT (15min)
https://t.co/0JeECvJ3QO


Advertisement